The short answer: NOAA says “very strong,” not “super”
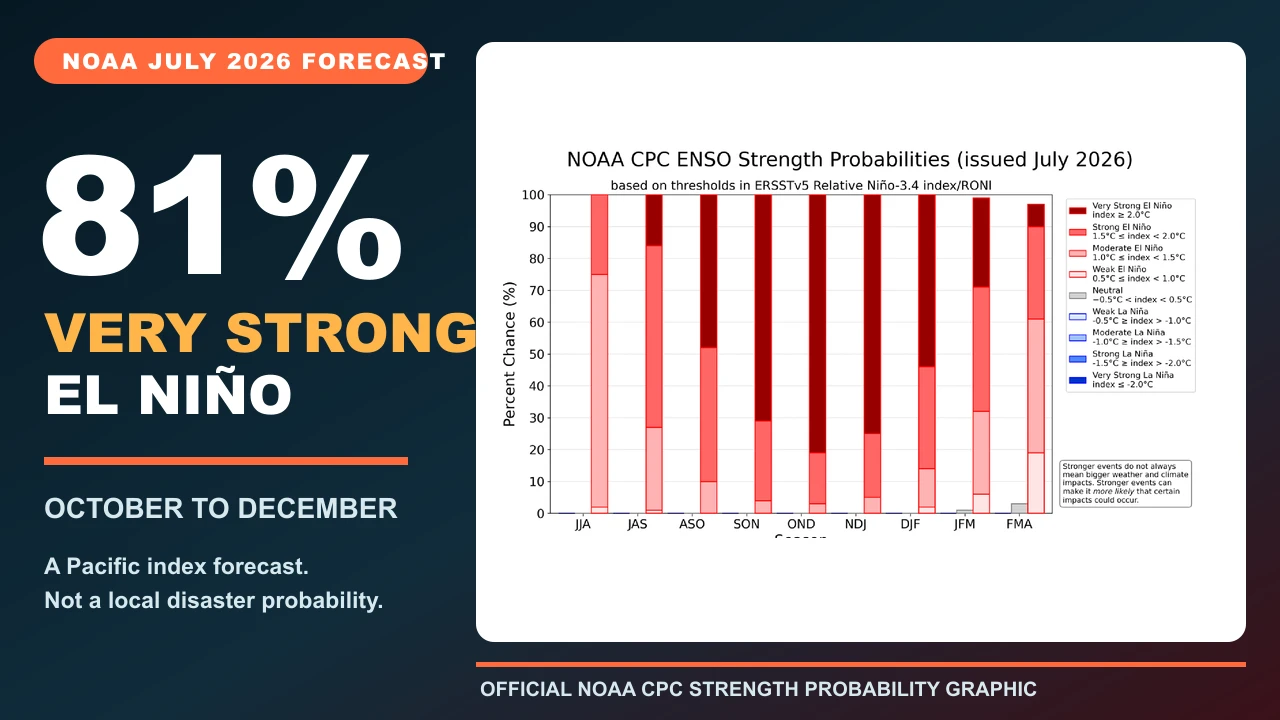
El Niño is already underway and strengthening. In its 9 July diagnostic discussion, the US Climate Prediction Center gave an 81% chance that it will be “very strong” during October to December 2026. NOAA said an event in that category would rank among the largest in the record that begins in 1950.
The word “super” is widely used as shorthand for an exceptionally powerful El Niño, including in some research. It is not a separate category in NOAA's current operational probability table. That table uses weak, moderate, strong and very strong. For this forecast, “very strong El Niño” is the exact official description.
The 81% figure answers one narrow question
The forecast asks whether the three-month Relative Oceanic Niño Index, shortened to RONI, will average at least +2.0 °C during October, November and December. NOAA's July table assigns 81% to that very strong category, 16% to strong and 3% to moderate. The remaining categories are shown as approximately zero for that season.
Those percentages describe competing strength categories for one climate index. They do not say there is an 81% chance of a disaster, an 81% chance that California will flood or an 81% chance that an individual town will have a warmer winter. A local outcome needs its own temperature, rainfall or hazard forecast.
Today's +1.2 °C reading does not contradict a +2.0 °C forecast
NOAA reported a latest weekly Niño-3.4 value of +1.2 °C on 9 July. That is a recent observation for one week. The very strong forecast is about a later three-month average after models expect the event to intensify. Comparing the two values as if they describe the same period creates a false contradiction.
The ocean and atmosphere were already behaving as a coupled El Niño system. NOAA observed warm water across the central and eastern equatorial Pacific, westerly wind anomalies, enhanced cloud and rain activity over the central Pacific and suppressed convection near Indonesia. The forecast is based on that evolving system, not the temperature number alone.
NOAA now uses a relative index for official strength forecasts
In 2026, the Climate Prediction Center adopted the Relative Oceanic Niño Index for operational tracking and forecasts. RONI begins with the sea-surface temperature departure in the Niño-3.4 region of the east-central equatorial Pacific, then accounts for the average temperature departure across the wider tropical oceans.
That relative comparison matters in a warming climate. A traditional anomaly measured against a historical baseline can make one Pacific region look unusually warm even when much of the tropical ocean is also warm. RONI is designed to isolate the contrast that is more closely connected to the atmospheric circulation changes at the heart of El Niño.
Very strong begins at +2.0 °C in the official table
NOAA's strength table divides positive RONI values into half-degree bands. Weak runs from +0.5 °C to below +1.0 °C, moderate from +1.0 °C to below +1.5 °C, strong from +1.5 °C to below +2.0 °C, and very strong begins at +2.0 °C. These are index thresholds, not surface temperatures across the entire Pacific.
The July outlook shows the probability building quickly. Very strong has a 16% chance in July to September, 48% in August to October, 71% in September to November and 81% in October to December. It then falls to 75% in November to January and 54% in December to February as the range of possible evolution widens.
Why “super El Niño” can create more certainty than the science allows
A memorable label compresses two different ideas: the strength of the tropical Pacific signal and the severity of weather somewhere else. NOAA separates them for a reason. Its probability graphic states that stronger events do not always mean bigger weather and climate impacts, although they can make some expected impacts more likely.
The term also does not have one universal research definition. Some studies have used standard deviations, some public explainers have used a +2.0 °C threshold and NOAA's current operational system uses the formal label “very strong.” A useful article should name the index, period and threshold instead of letting one dramatic word carry all three.
The event is highly likely to last into early 2027
NOAA gives a 97% chance that El Niño will persist through early Northern Hemisphere spring 2027. That persistence forecast is different from the 81% strength forecast. One asks whether El Niño conditions continue; the other asks which strength category the index reaches during a specific late-2026 season.
The confidence comes from several lines of evidence, including the observed ocean-atmosphere coupling, a recent downwelling Kelvin wave that carried heat eastward below the surface and broad agreement across the North American Multi-Model Ensemble. NOAA's next scheduled diagnostic discussion is 13 August 2026, so the percentages are not meant to remain frozen.
A powerful Pacific signal still cannot script every region
El Niño shifts warm water, tropical rainfall and large-scale circulation across the Pacific. Those changes can influence jet streams and seasonal weather patterns far from the equator. They tilt the odds, but other climate drivers, ocean conditions, land conditions and day-to-day weather systems still affect what happens in a particular place.
NOAA's own warning is unusually direct: even the strongest El Niño events do not produce the typical impact everywhere. Historical composites show what happened more often across many previous events. They are not a weather map for every week of 2026 or a guarantee that an individual storm was caused by El Niño.
The United States outlook becomes more El Niño-like toward winter
NOAA's 16 July long-lead outlook says El Niño teleconnections are expected to become more influential through fall 2026 and winter 2026 to 2027. The forecast increasingly favours wetter conditions across parts of the southern tier, especially the Southeast in winter, alongside drier probabilities across parts of the Northwest and northern United States.
That pattern is probabilistic and changes by season and location. NOAA's historical guidance says El Niño influence on the United States is generally strongest in winter, while individual events still differ. A homeowner, farmer or traveller should use the current CPC map for the relevant months, then use shorter-range forecasts as the date approaches.
The Atlantic hurricane effect is real, but it is not a shield
El Niño often increases vertical wind shear across the tropical Atlantic, making it harder for thunderstorms to organise into hurricanes. NOAA's 2026 Atlantic outlook consequently favoured a below-normal season and cited the expected strong El Niño as an important factor.
Below normal does not mean no storms, no landfalls or no destructive hurricane. NOAA's June range still included 8 to 14 named storms, 3 to 6 hurricanes and 1 to 3 major hurricanes. Coastal residents need official storm forecasts and local emergency advice; a seasonal El Niño label cannot tell one household whether a cyclone will approach.
Australia needs the Bureau's local outlook, not a US winter map
For Australia, El Niño is commonly associated with reduced winter and spring rainfall in parts of the east and south, warmer conditions and higher fire-weather risk. The Bureau of Meteorology says the 2026 event is established and strengthening, but it also warns that a strong Pacific event does not guarantee strong effects in every Australian location.
The current Australian outlook has its own regional probabilities and other drivers, including the Indian Ocean Dipole and Southern Annular Mode. Our separate Australia guide explains the Bureau's rainfall and temperature outlook in detail. A global strength number is useful context, not a replacement for the national and local forecast.
Globally, the same event can raise opposite risks in different places
The World Meteorological Organization said in early July that the strengthening event increases the likelihood of heatwaves, drought, heavy rainfall and other extremes in many regions. That list is not contradictory. El Niño redistributes ocean heat and tropical rainfall, so one region can become drier while another becomes wetter.
WMO forecast rapid development into a strong event during July to September and said model agreement was high. It also emphasised regional climate services and early warnings. The practical response is therefore not one global prediction, but a chain from the Pacific outlook to regional seasonal guidance, then national warnings and short-range local forecasts.
What would change the forecast next
Watch the monthly NOAA diagnostic discussion and strength table rather than a single viral graphic. The most informative changes will be shifts in the three-month category probabilities, continued ocean-atmosphere coupling, subsurface heat and how the major forecast ensembles converge or spread. A weekly Niño-3.4 value can move without overturning the seasonal outlook.
For impacts, use the forecast that actually measures the outcome you care about. That may be a CPC seasonal rainfall map, a Bureau long-range outlook, an Atlantic hurricane update or a local seven-day forecast. The 81% number is striking because the expected Pacific event is exceptional. Its careful meaning is narrower, and more useful, than “extreme weather everywhere.”
Sources and further reading
- NOAA Climate Prediction Center: 9 July 2026 ENSO Diagnostic Discussion ↗
- NOAA Climate Prediction Center: July 2026 official ENSO strength probabilities ↗
- NOAA Climate Prediction Center: why the Relative Oceanic Niño Index was adopted ↗
- NOAA Climate Prediction Center: 16 July 2026 long-lead US seasonal outlook ↗
- NOAA Climate.gov: El Niño and La Niña frequently asked questions ↗
- NOAA Atlantic Oceanographic and Meteorological Laboratory: 2026 Atlantic hurricane outlook and El Niño ↗
- World Meteorological Organization: July 2026 global El Niño update ↗
- Australian Bureau of Meteorology: current El Niño monitoring ↗
This article was written for Curiosity Desk. We do not copy other publishers or invent quotes. If a material error is found, we correct it openly.
Read the full standards →One answer should lead to a better question
Bring your curiosity to the group
Curious Minds is our public Facebook community for surprising science, strange history, Australian wildlife and everyday questions. No copied posts, no personal-friend invitations and no link dumping.
- Three self-contained discussion prompts each week
- Sourced answers and honest uncertainty
- Respectful conversation without spam