World Explained · Earth and environment
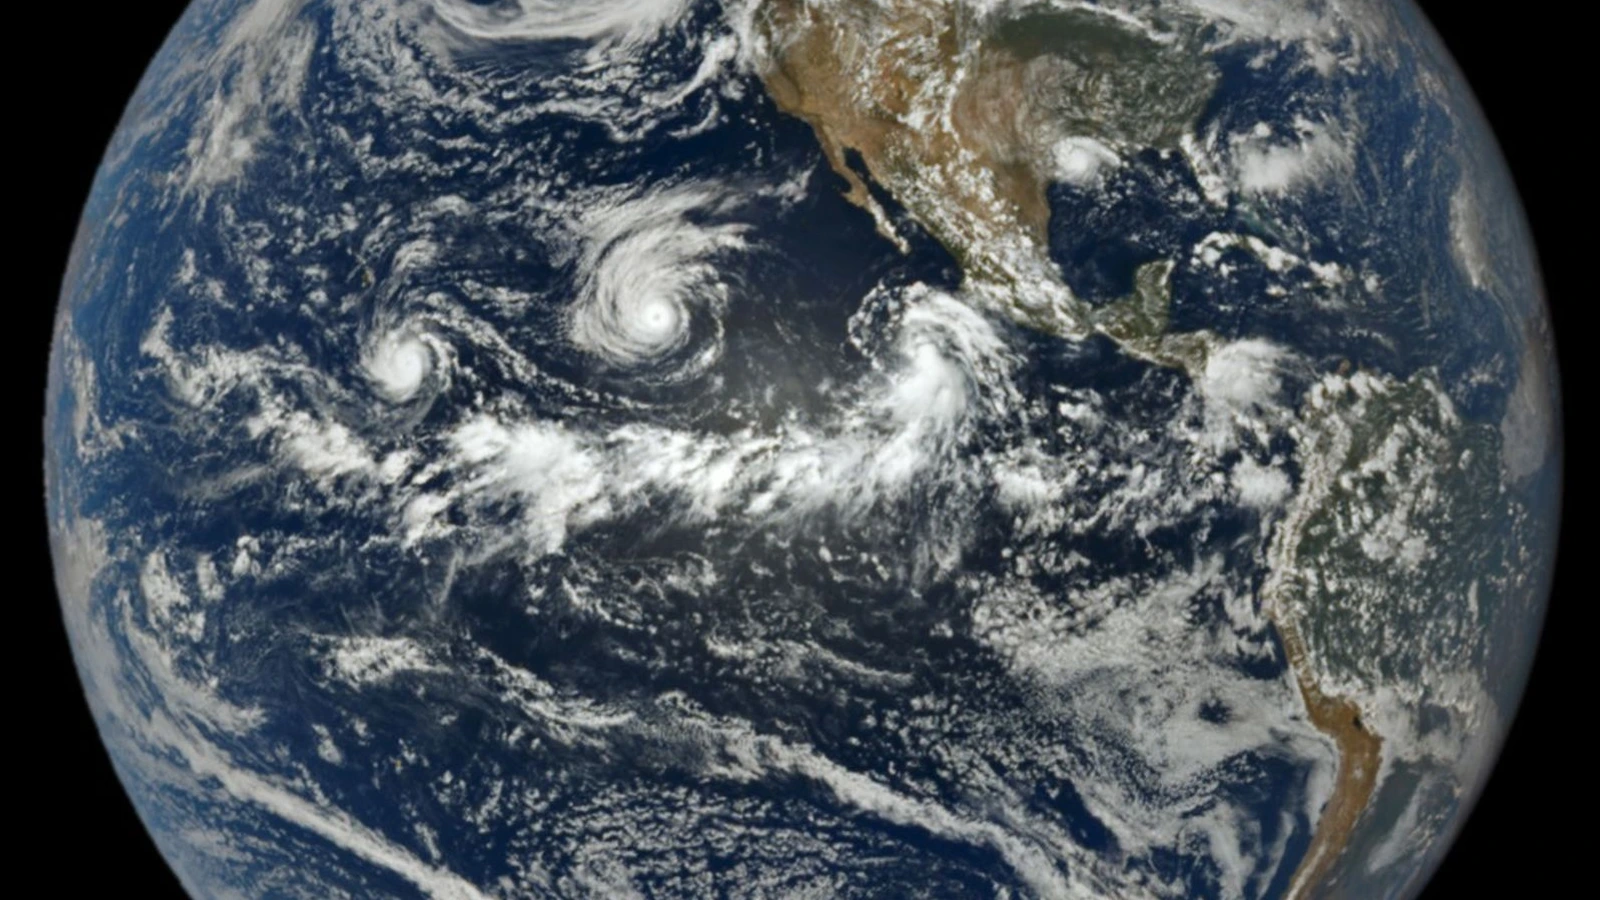
How satellites reveal an unusually busy Pacific cyclone season
A NASA EPIC image caught three Pacific cyclones at once. Here is what the 2026 count, basin definitions and El Niño can—and cannot—tell us.
Big ideas made clear
Space, astronomy, physics, geology, weather, materials and everyday science explained without losing the wonder.
102 published storiesNewest first
World Explained · Earth and environment
A NASA EPIC image caught three Pacific cyclones at once. Here is what the 2026 count, basin definitions and El Niño can—and cannot—tell us.
World Explained · Space and technology
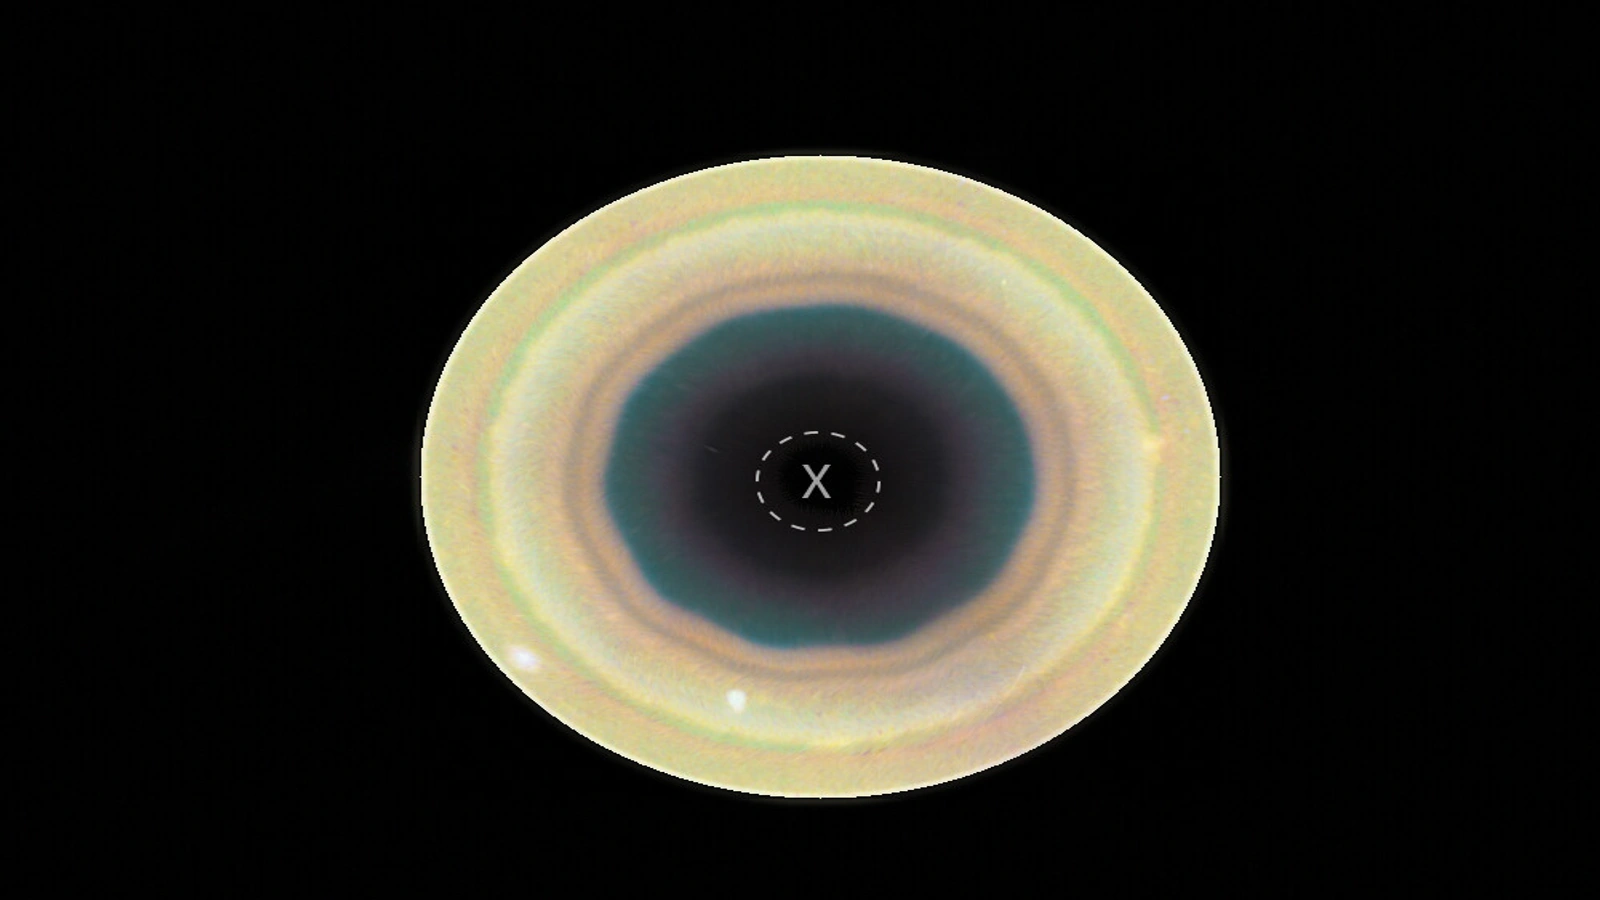
Hubble found a moving 10-sided wave at Saturn’s south pole. Its shape is real; why it formed and how long it will last remain open questions.
World Explained · Space and technology
NASA's planned Mars Telecommunications Network could put a dedicated relay around Mars between missions and Earth. Here is how the handoff works—and what remains unproved.
World Explained · Space and technology
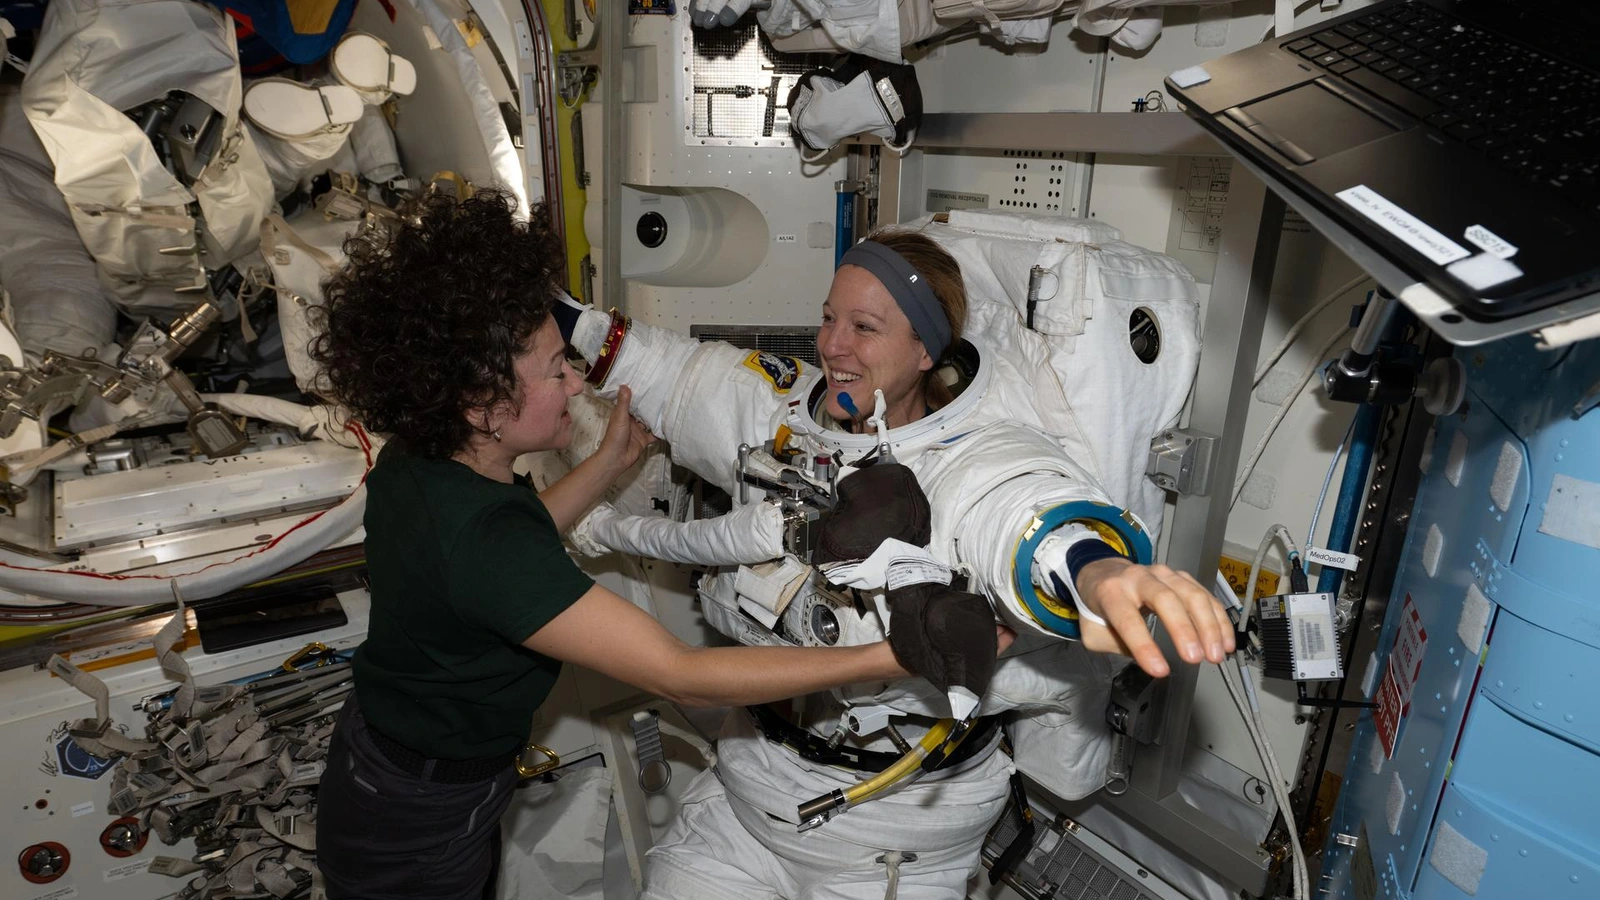
A planned ISS spacewalk will replace a Harmony retroreflector and route data-relay cables. Here is what those tasks can support—and what NASA has not yet measured.
World Explained · Space and technology
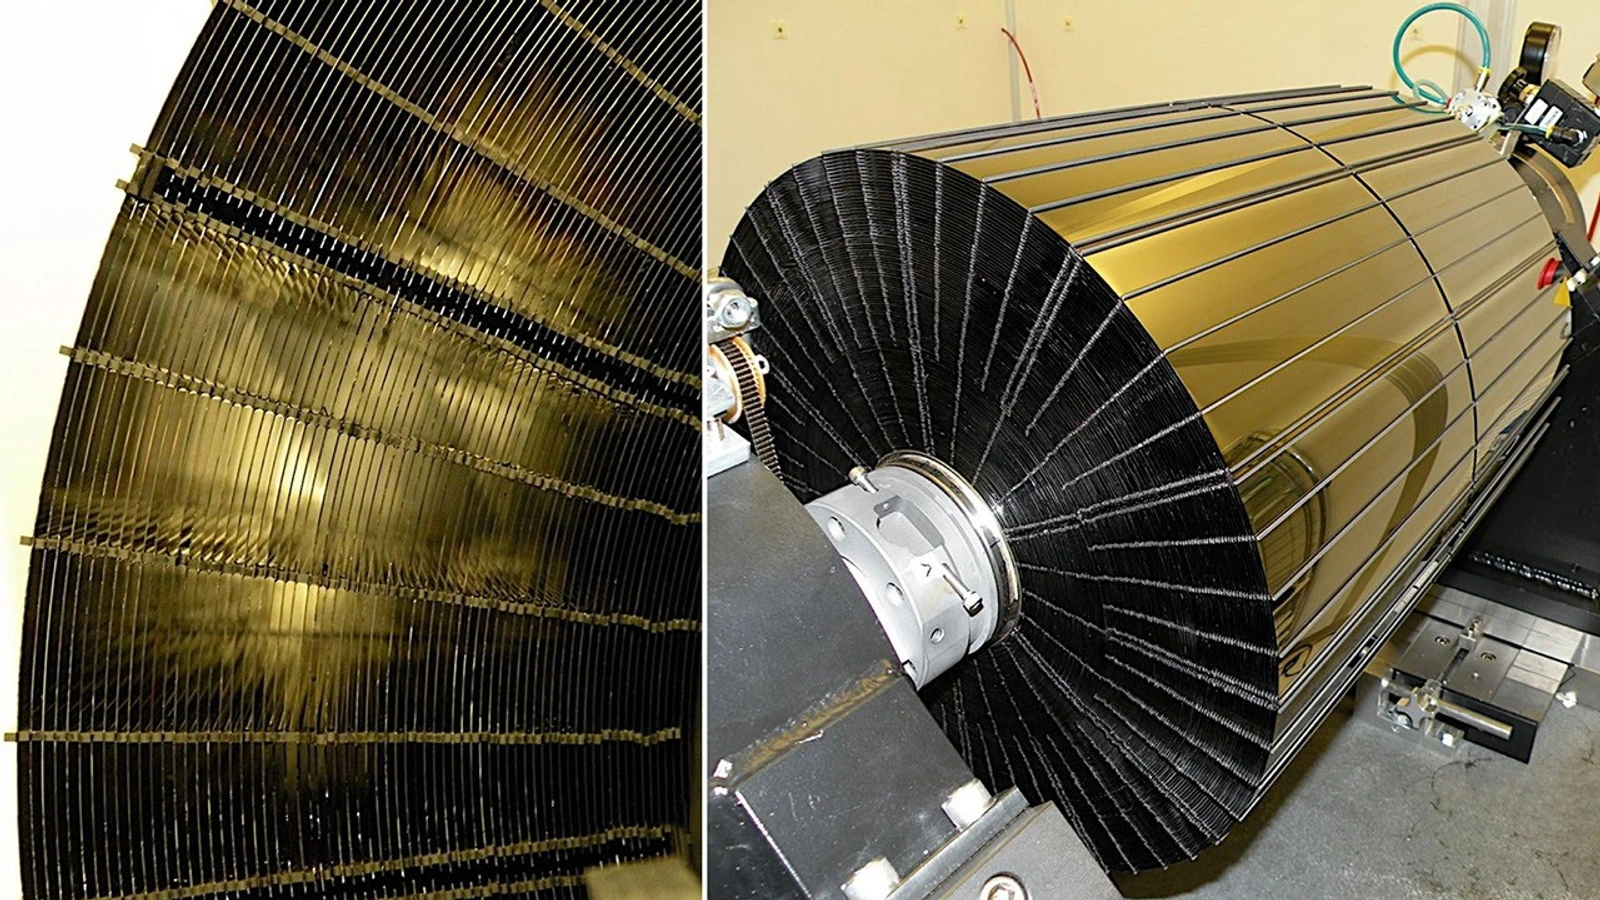
NASA's NuSTAR saw a 1,100-second hard-X-ray transient at a precise sky position, but no catalogued source there. The signal is real data with an identity still to test.

Better Home · Cleaning science
Baking soda brings mild alkalinity and fine particles, not detergent, disinfectant or automatic safety for every surface. The soil and material decide whether it helps.
World Explained · Space and astronomy
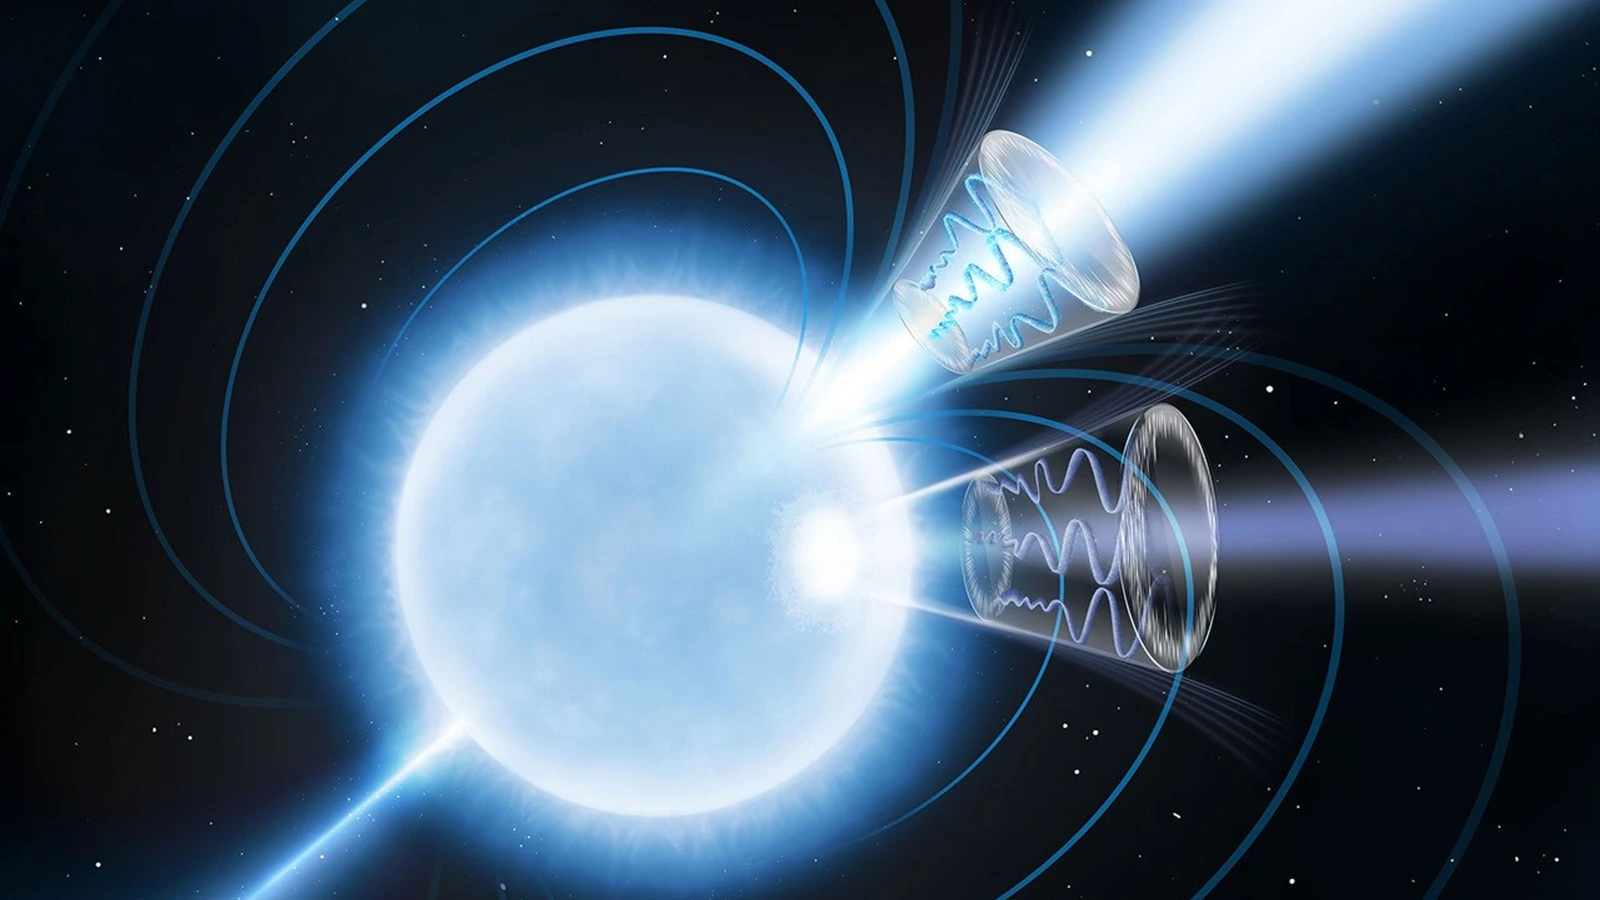
A magnetar's field can change how polarized X-rays travel through the quantum vacuum. IXPE measured the light's polarization—not empty space itself.
World Explained · Space and astronomy
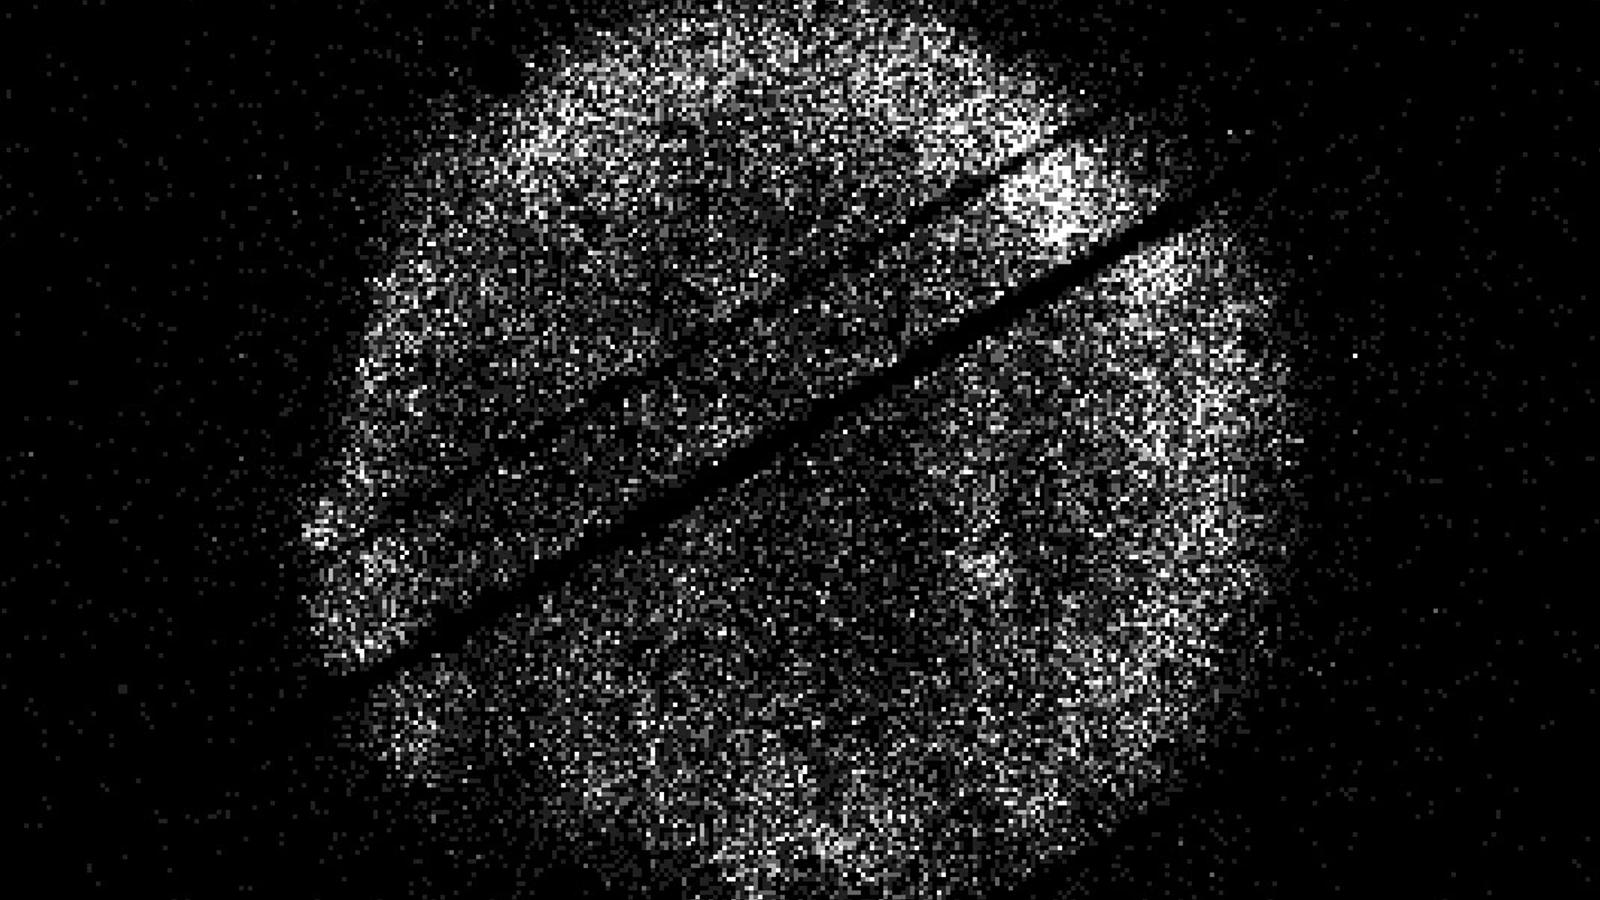
NASA's Swift observatory has restarted its ultraviolet/optical and X-ray telescopes. The mechanism is a careful drag tradeoff, not a completed orbit rescue.
World Explained · Earth and environment
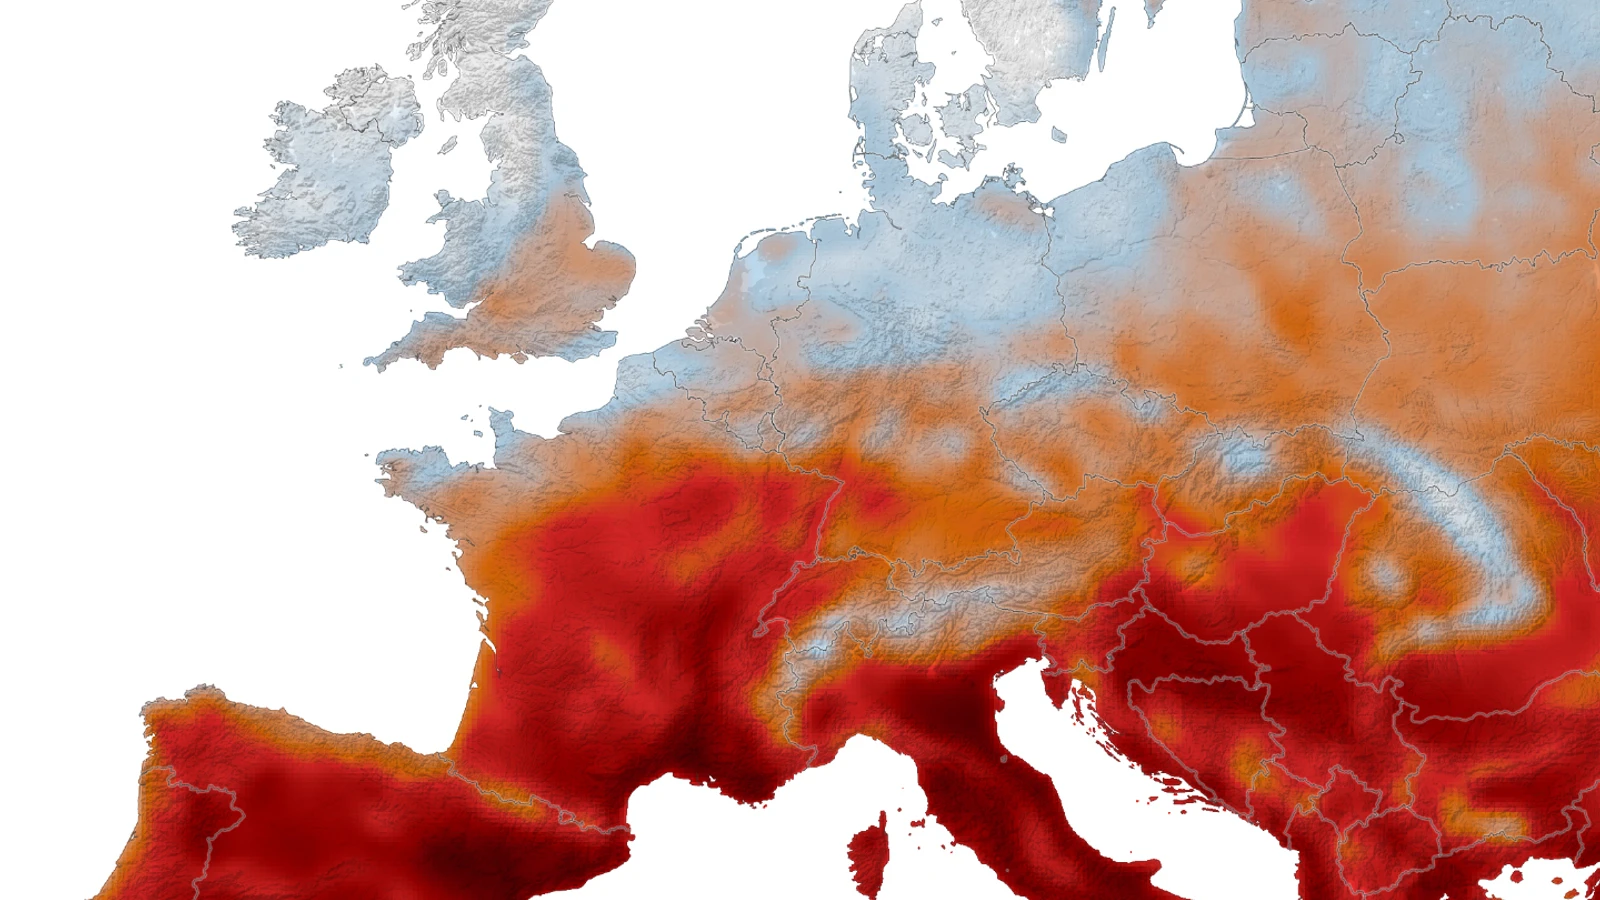
NASA's GEOS-FP model combines satellite observations and atmospheric physics to map daily maximum surface-air temperature across Western Europe during summer heat waves in 2026.
World Explained · Earth and environment
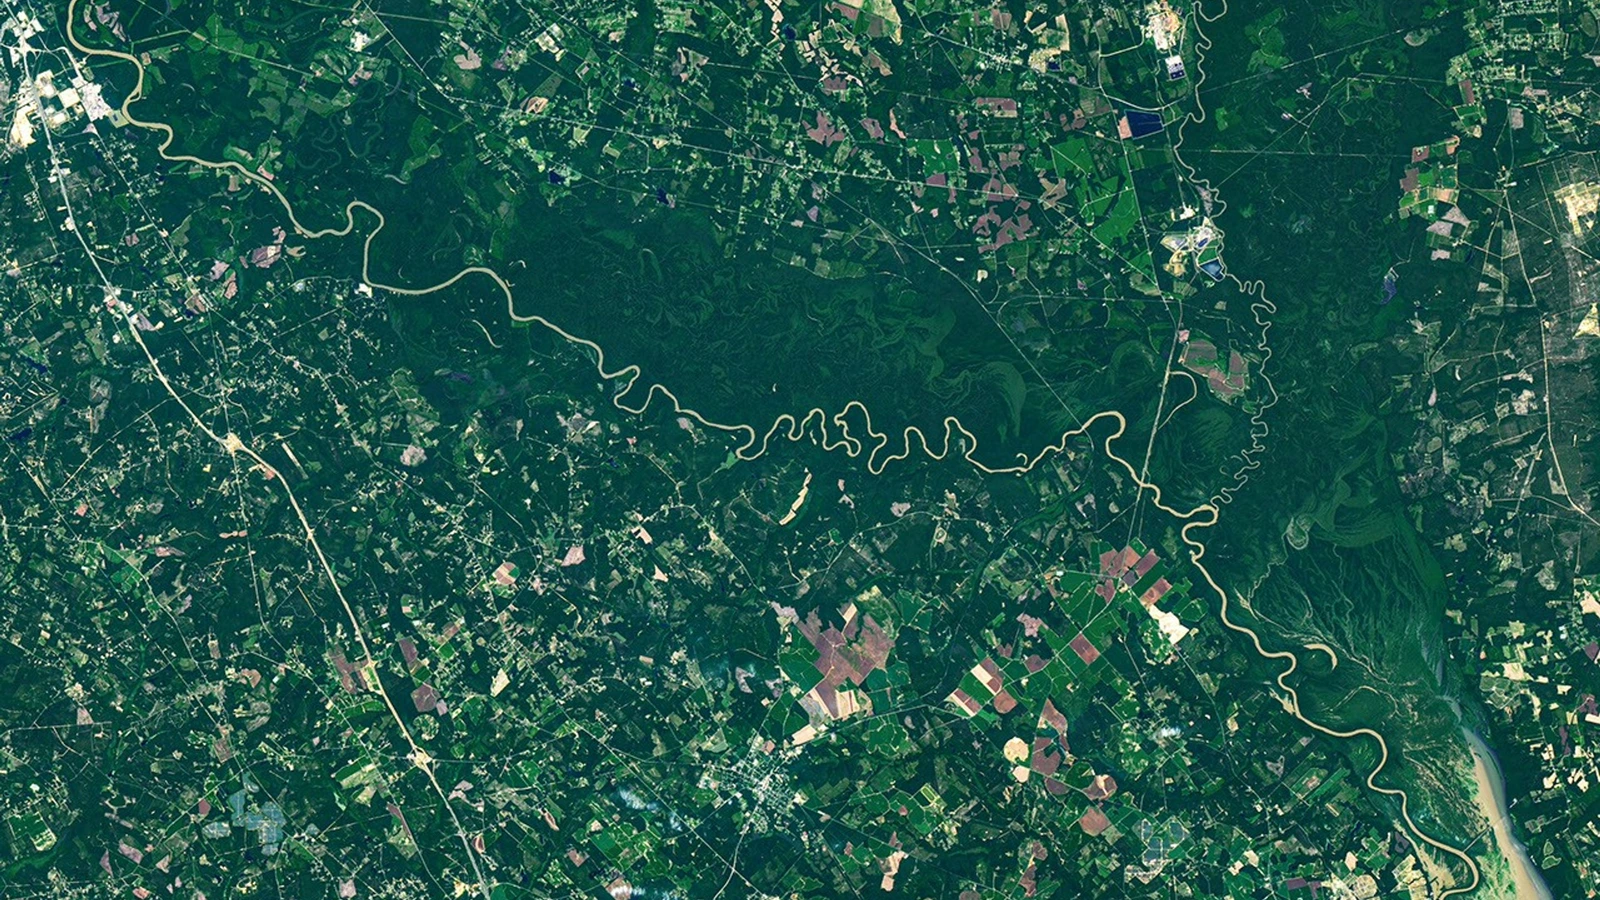
A river can erode one bank, build the other and leave an old channel behind. Here is how oxbow lakes and floodplain habitats emerge.
World Explained · Earth and environment
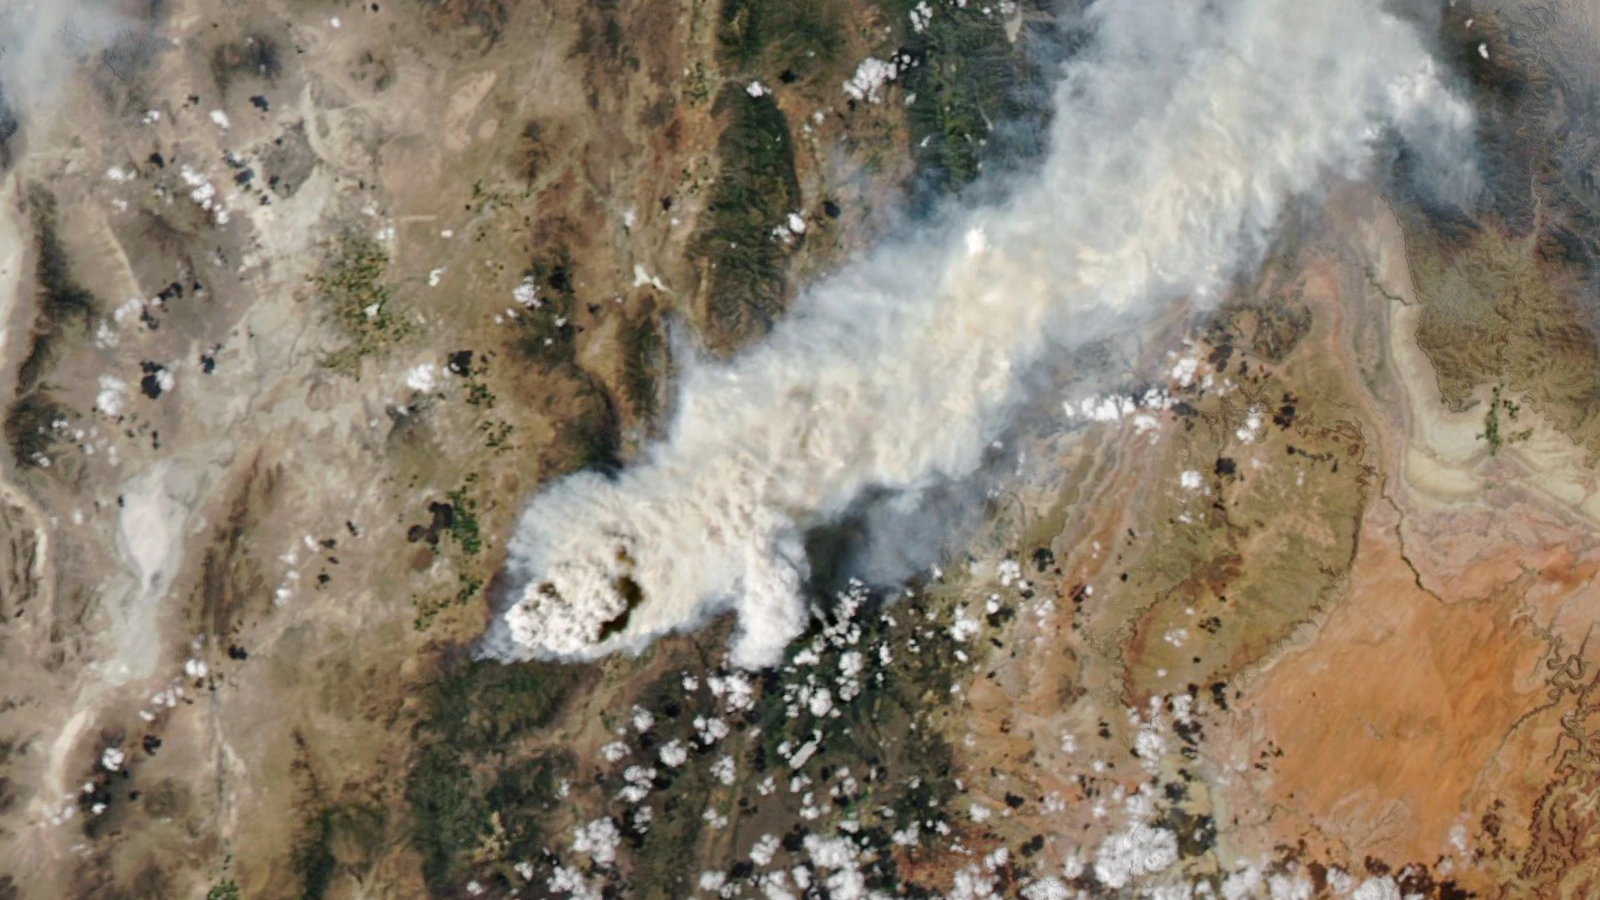
Pyrocumulonimbus clouds can lift wildfire smoke toward the stratosphere. Here is how satellites find the high cloud, how SAGE III reads aerosol layers and what INSPYRE is testing.
World Explained · Space and technology
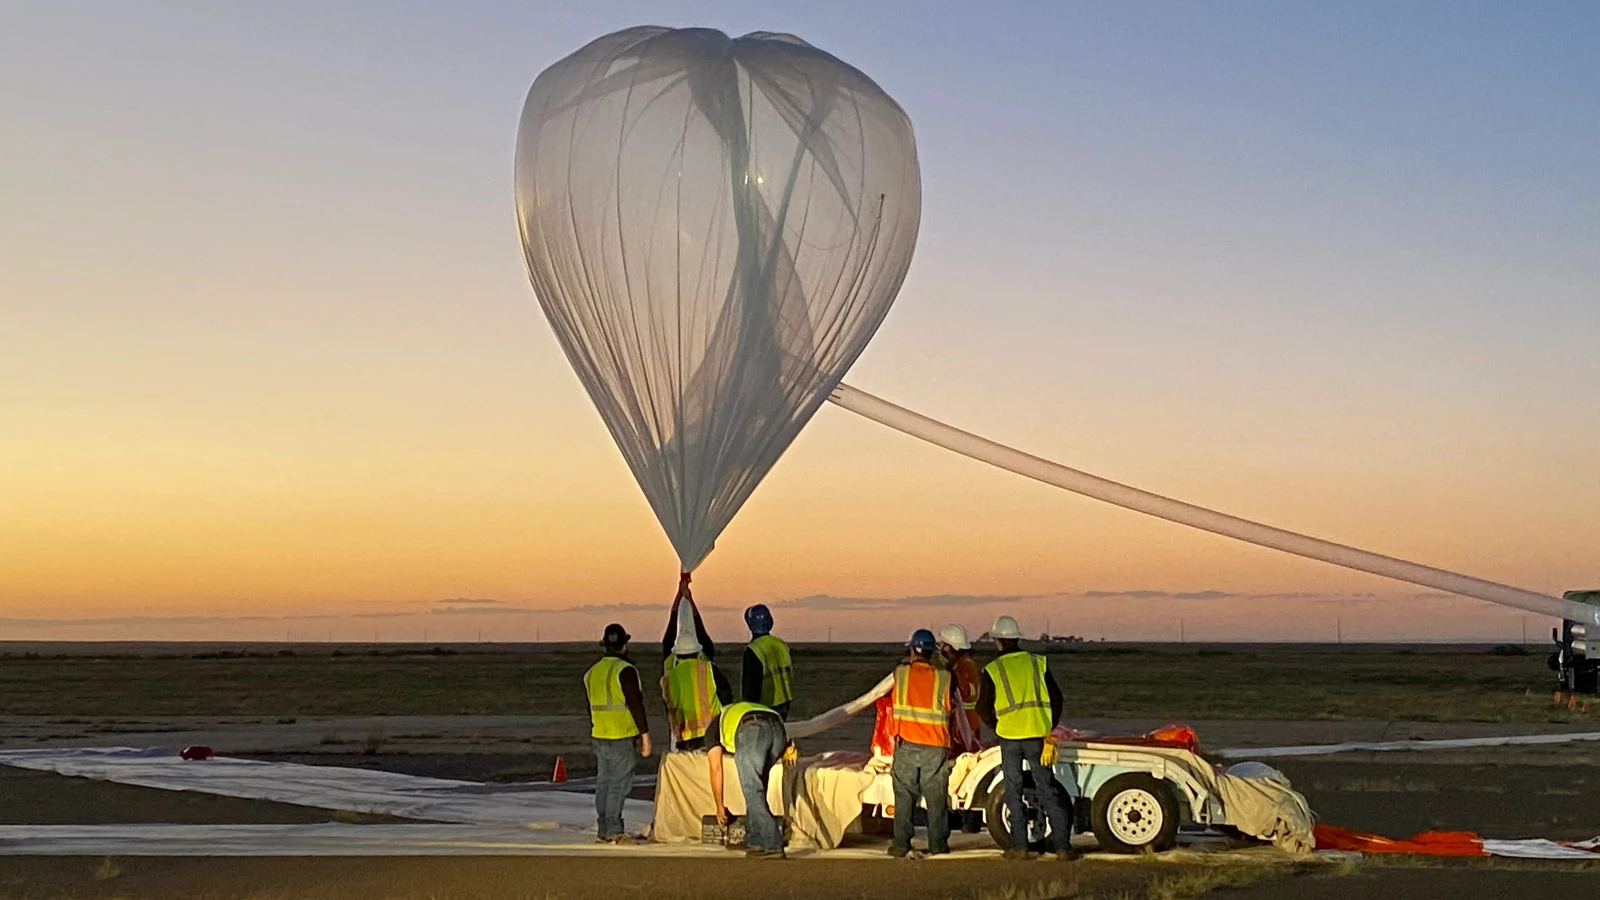
NASA's CLIC 2 flew a real-time imaging camera on a scientific balloon. Here's what the high view can show about landing terrain—and what it cannot prove.
World Explained · Earth and climate
A Landsat 9 image caught an unusually large Greenland iceberg in the Denmark Strait. Here's how its route was reconstructed—and why its birthplace remains uncertain.
World Explained · Space and technology
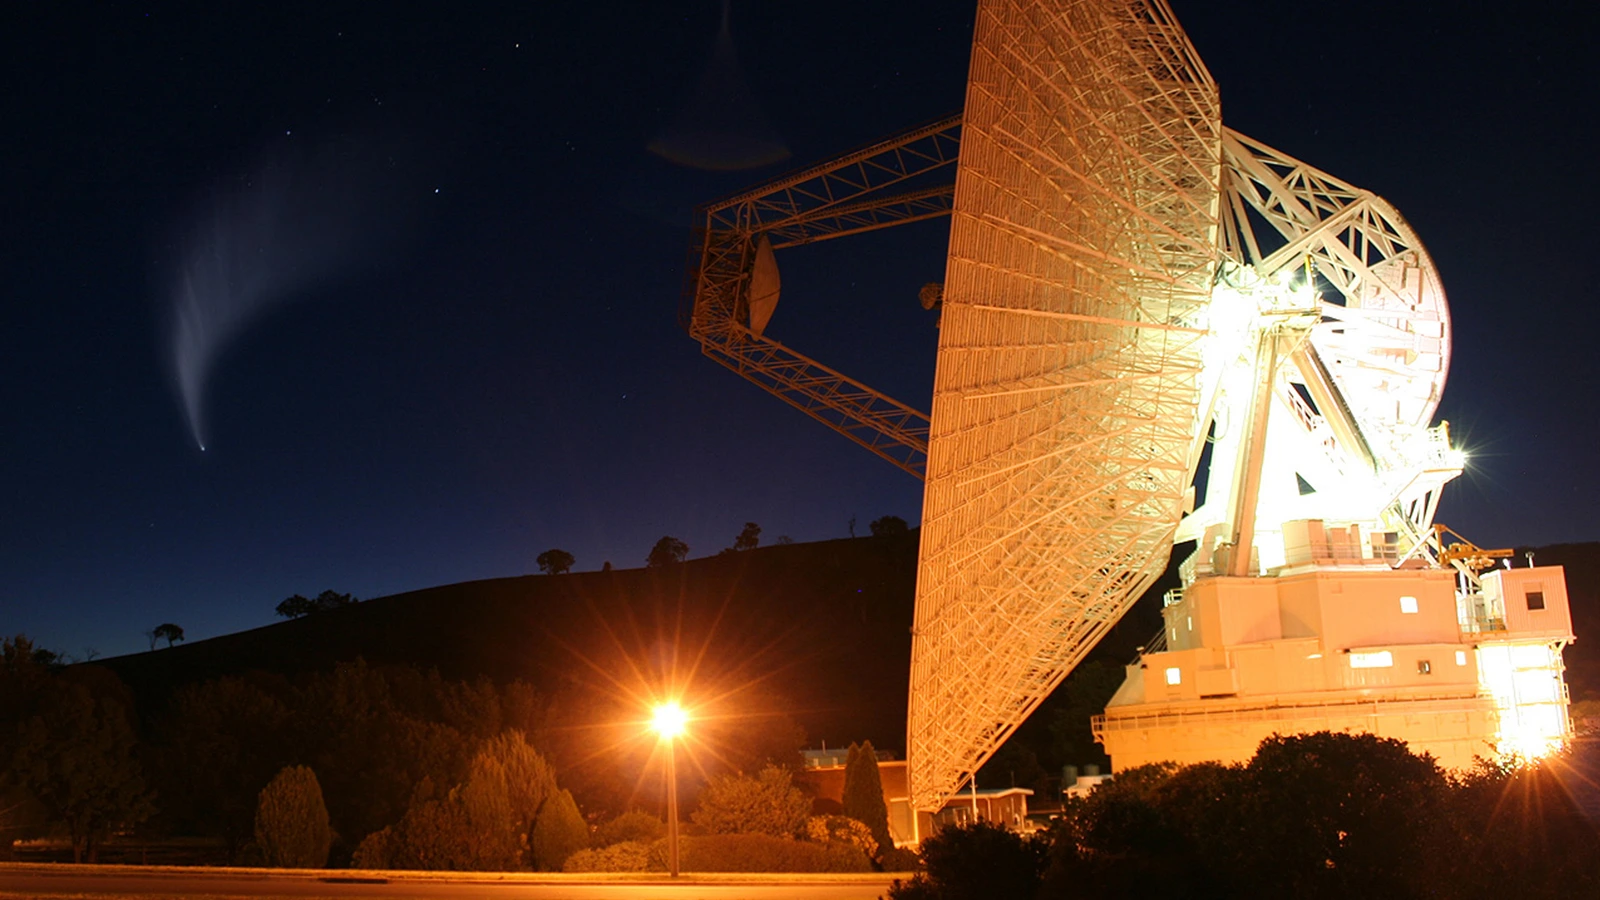
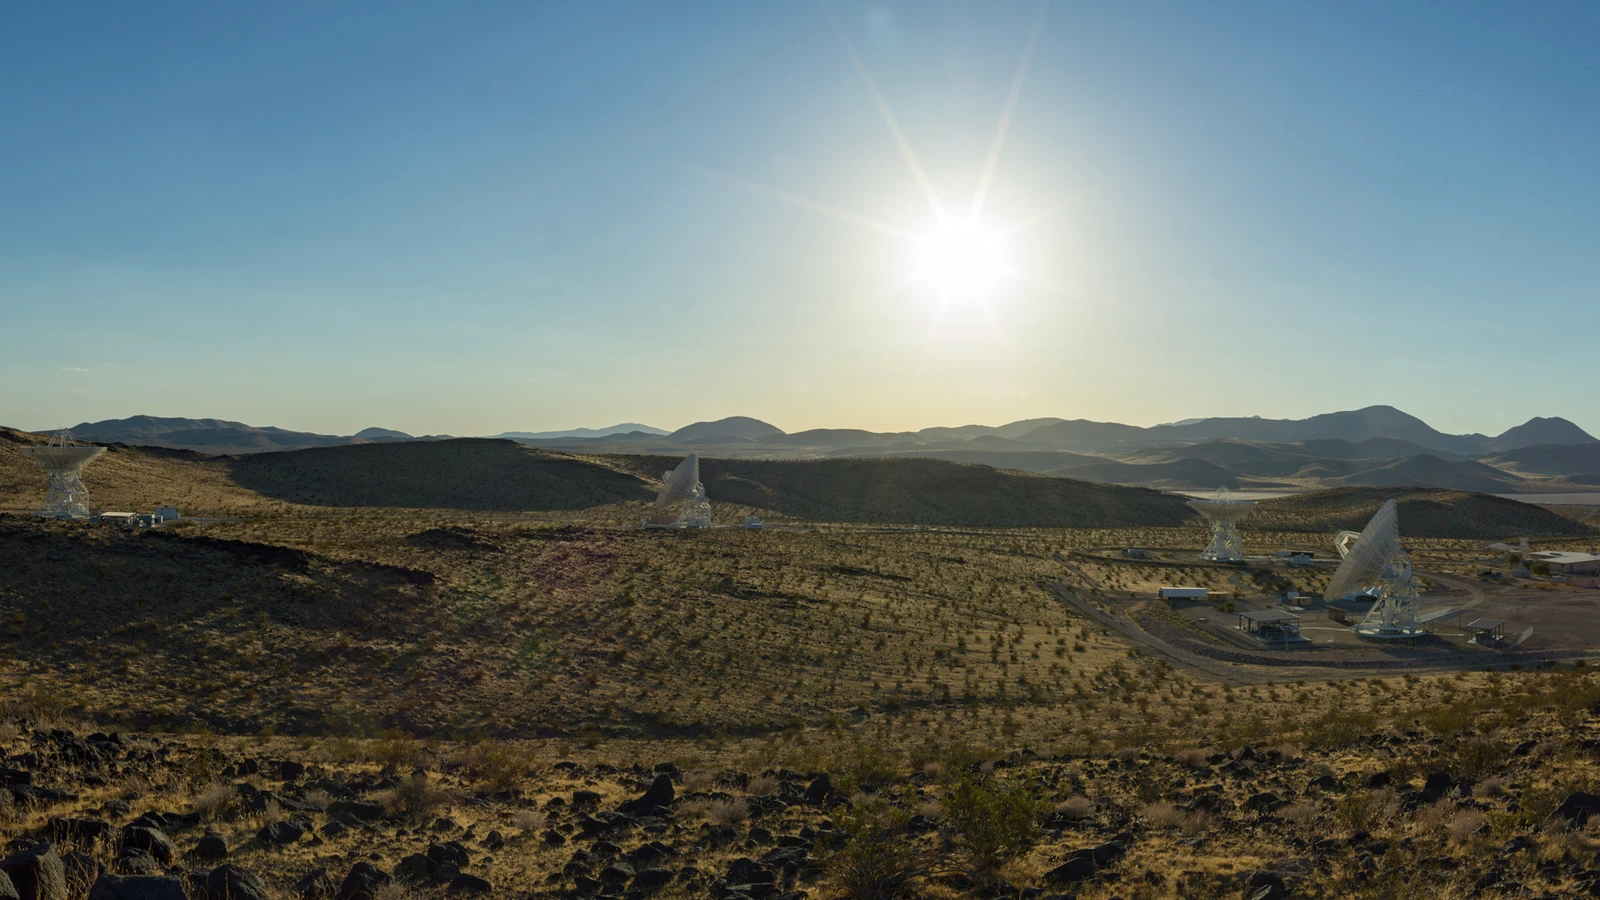
NASA's new DSS-23 dish adds a 34-metre radio-frequency antenna at Goldstone. Here is how the signal path and global handoff work—and what capacity cannot promise.
World Explained · Earth and environment
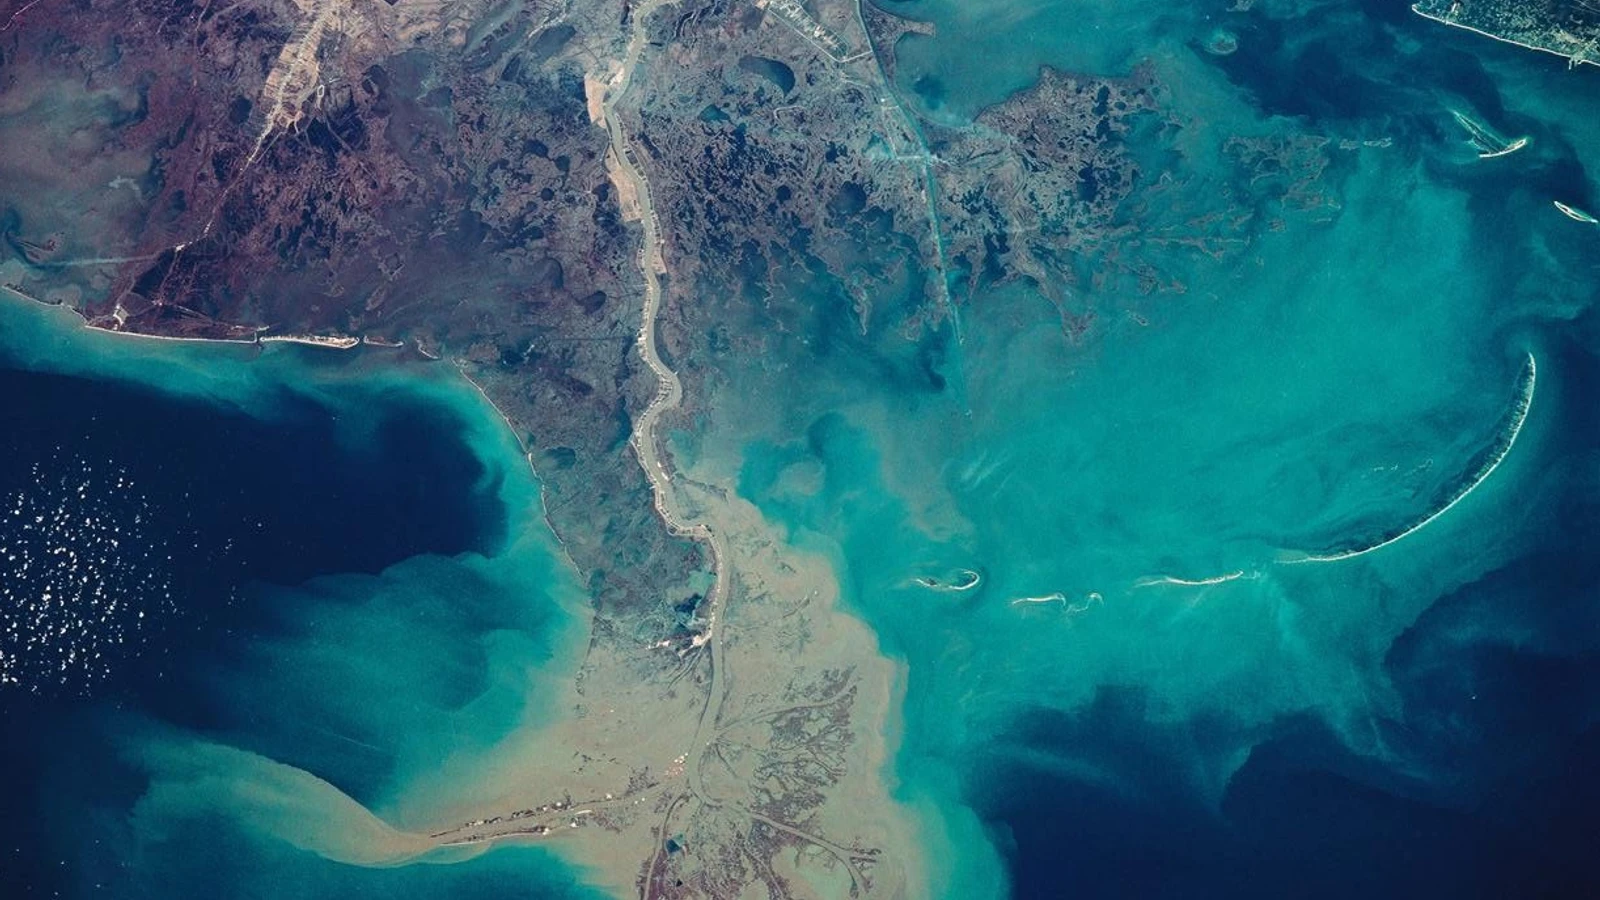
New NASA-supported research tracks carbon moved by coastal marsh erosion—and why land-to-ocean transfer is not the same as direct air emission.
World Explained · Space and astronomy
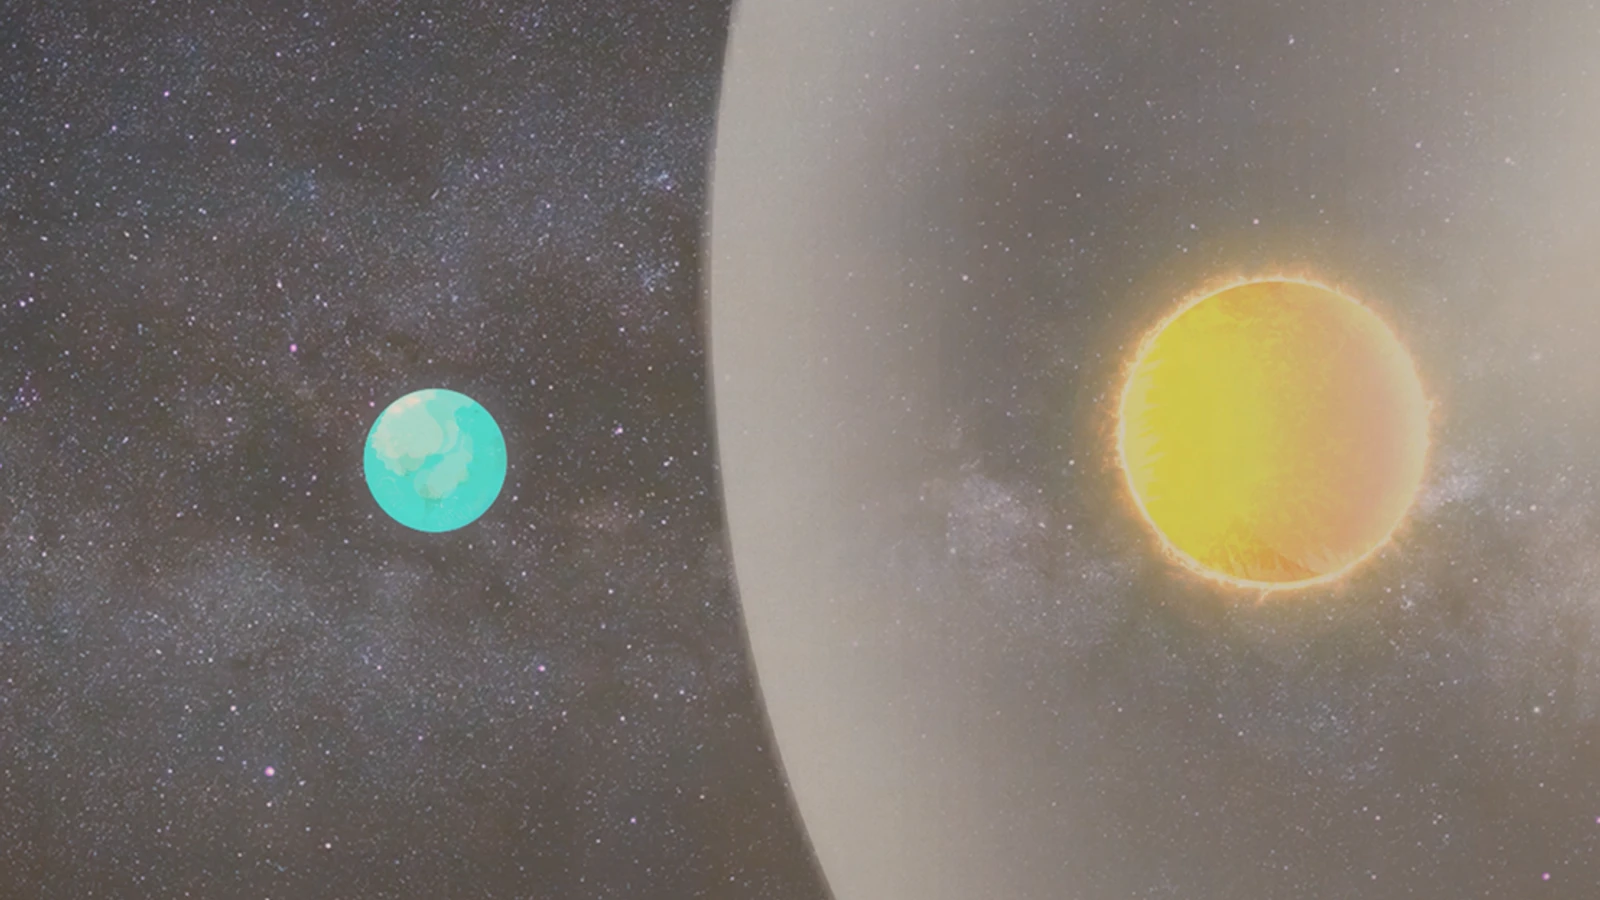
A dense interstellar cloud could have squeezed the Sun's protective heliosphere inside Earth's orbit. Here's what the models and geological clues do—and do not—show.
World Explained · Space and astronomy
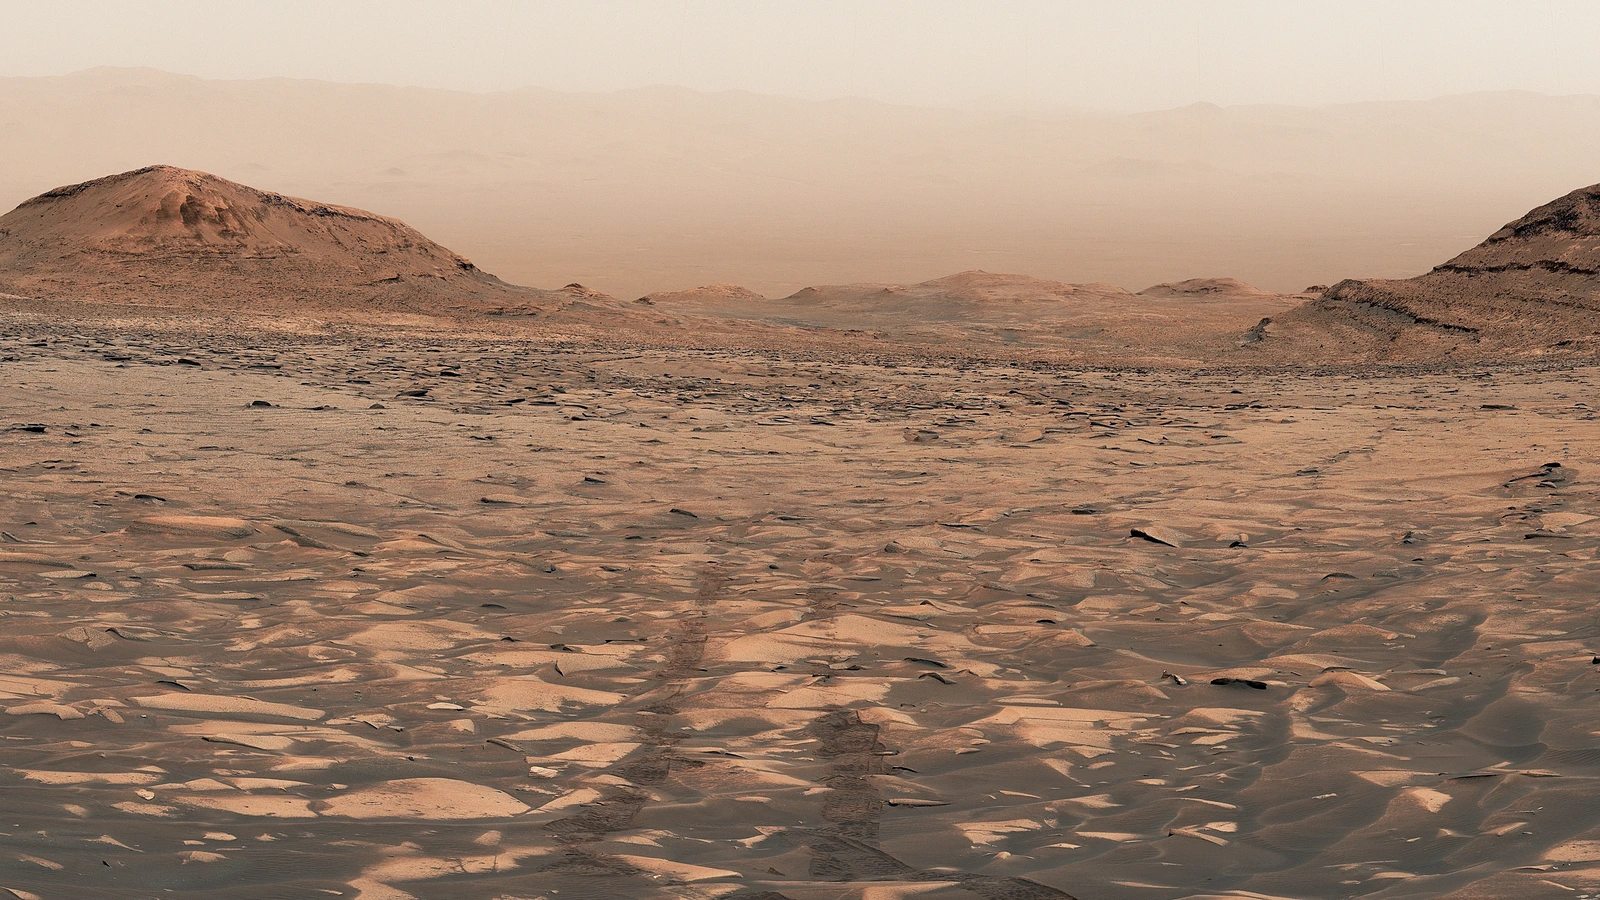
NASA says Curiosity has gained 1 kilometre in elevation on Mount Sharp. Its 323-image Mastcam panorama shows the terrain—and the limits of that evidence.
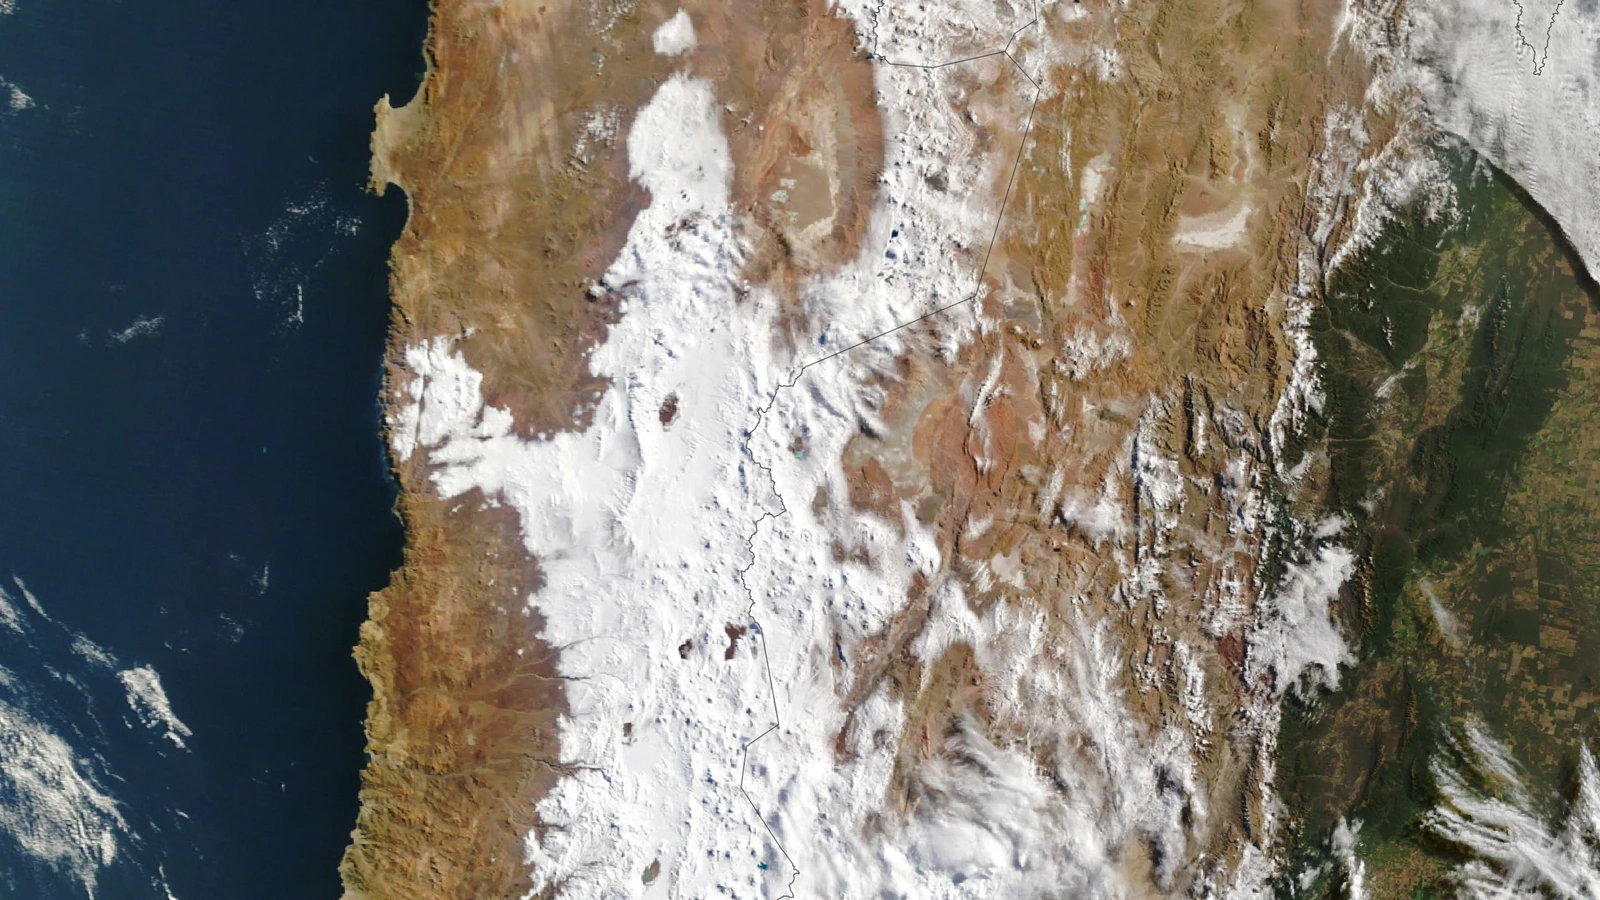
World Explained · Earth and environment
NASA's August scenes show snow crossing a desert that rarely sees it. Here is how Landsat, MODIS and a cutoff low fit together—and what the event does not prove.
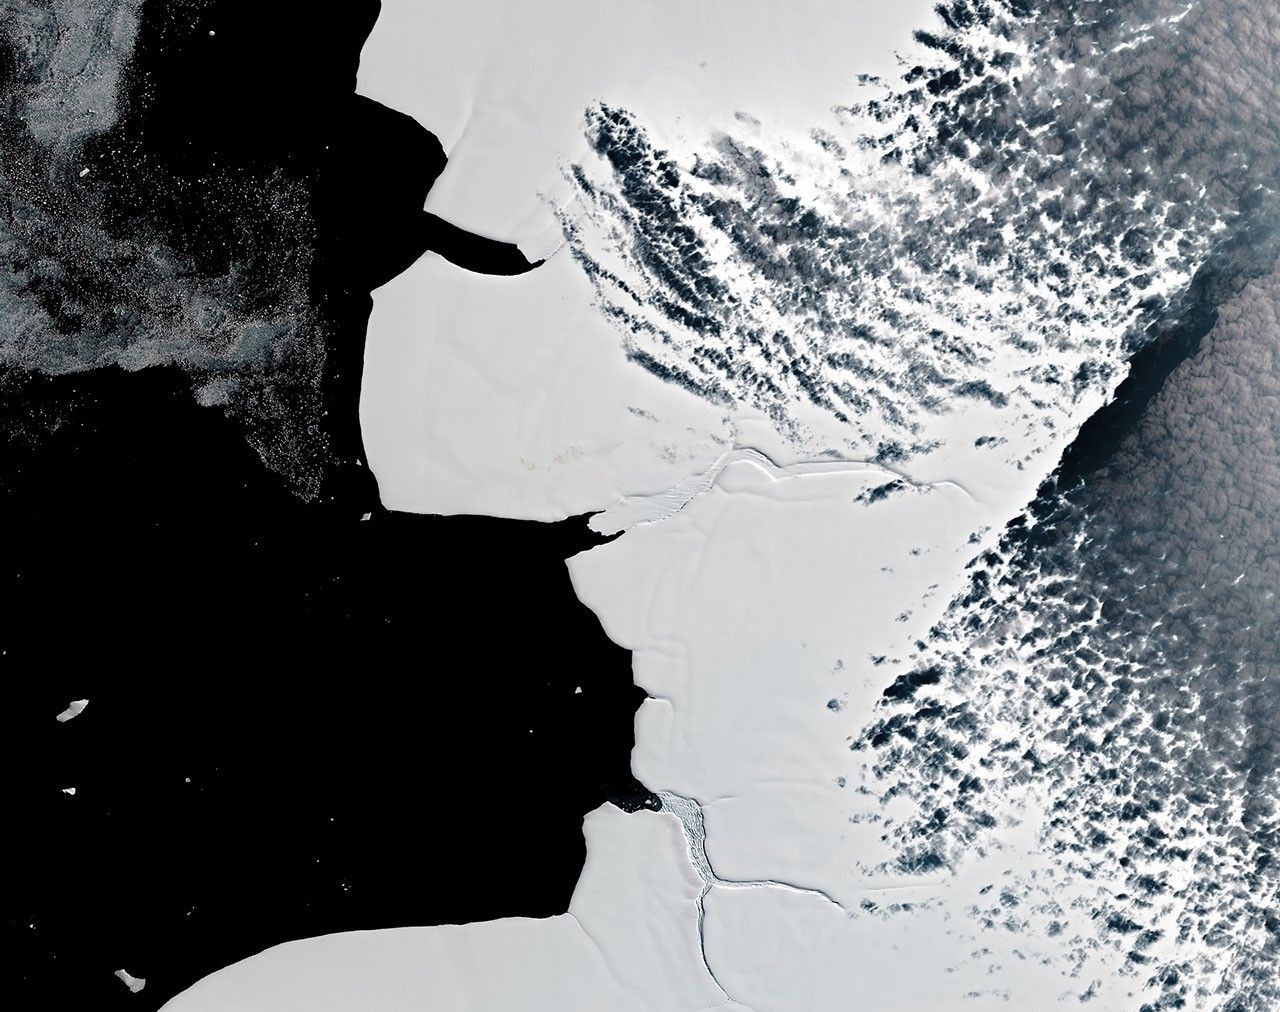
World Explained · Earth and environment
Landsat cannot count individual emperor penguins, but decades of scenes can reveal guano traces, colony moves and sea-ice context.
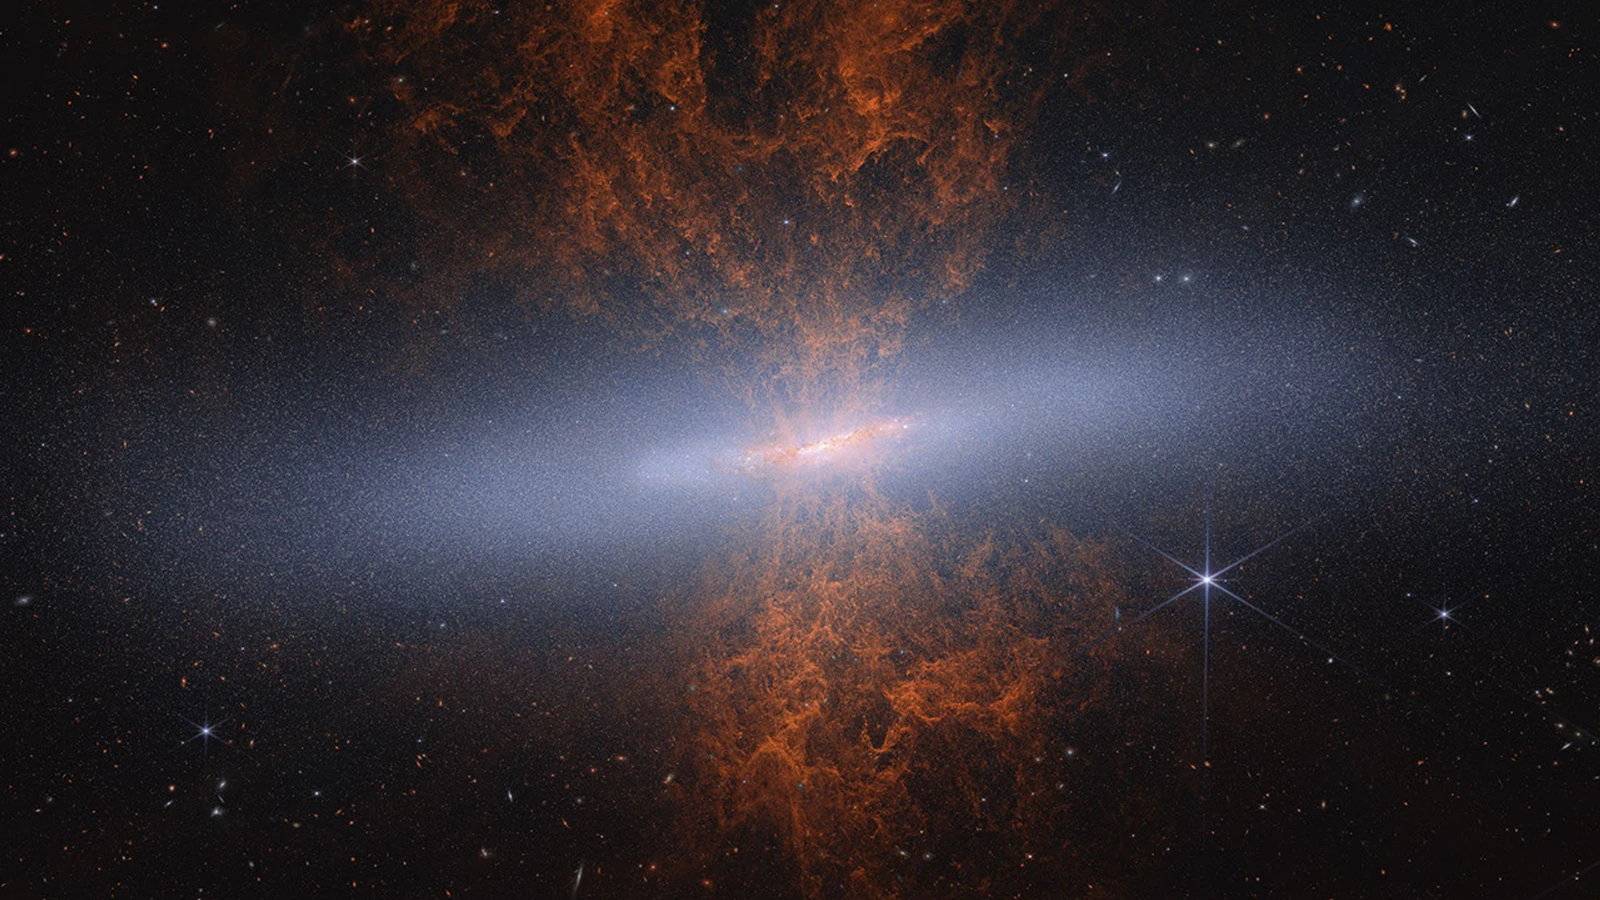
World Explained · Space and astronomy
Webb's infrared view brings millions of stars into M82's dusty Cigar Galaxy. Here is what the image establishes about the starburst—and where the wind's trigger remains open.
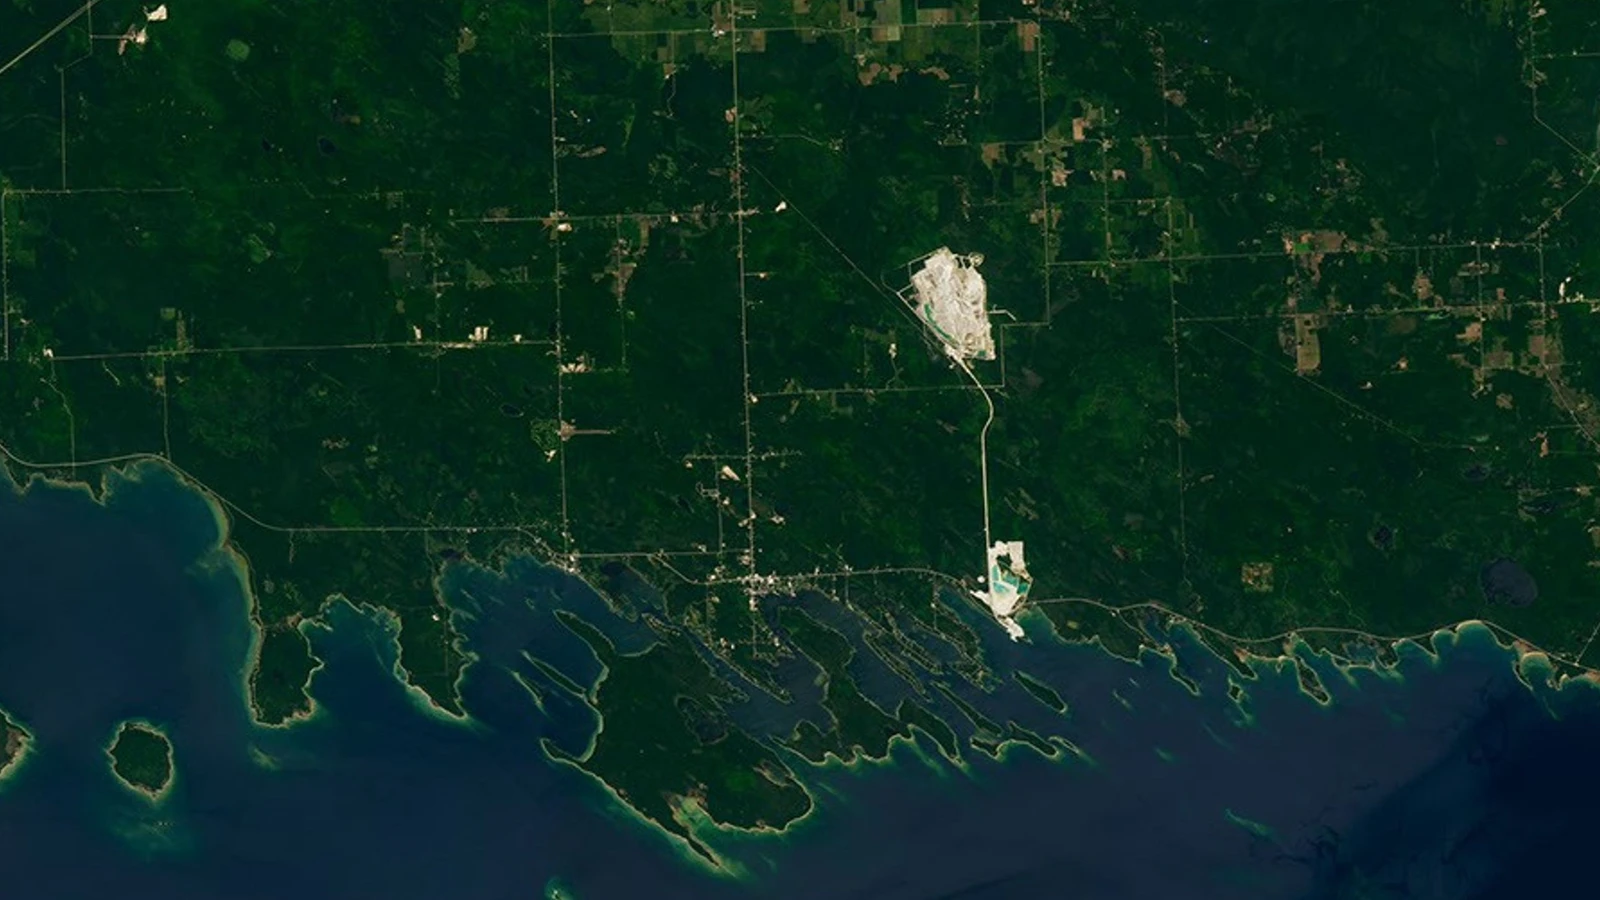
World Explained · Earth and climate
A Landsat 9 image makes Michigan's parallel Les Cheneaux Islands easy to see. Here's what glaciers likely shaped—and what one view cannot date.
World Explained · Space and astronomy
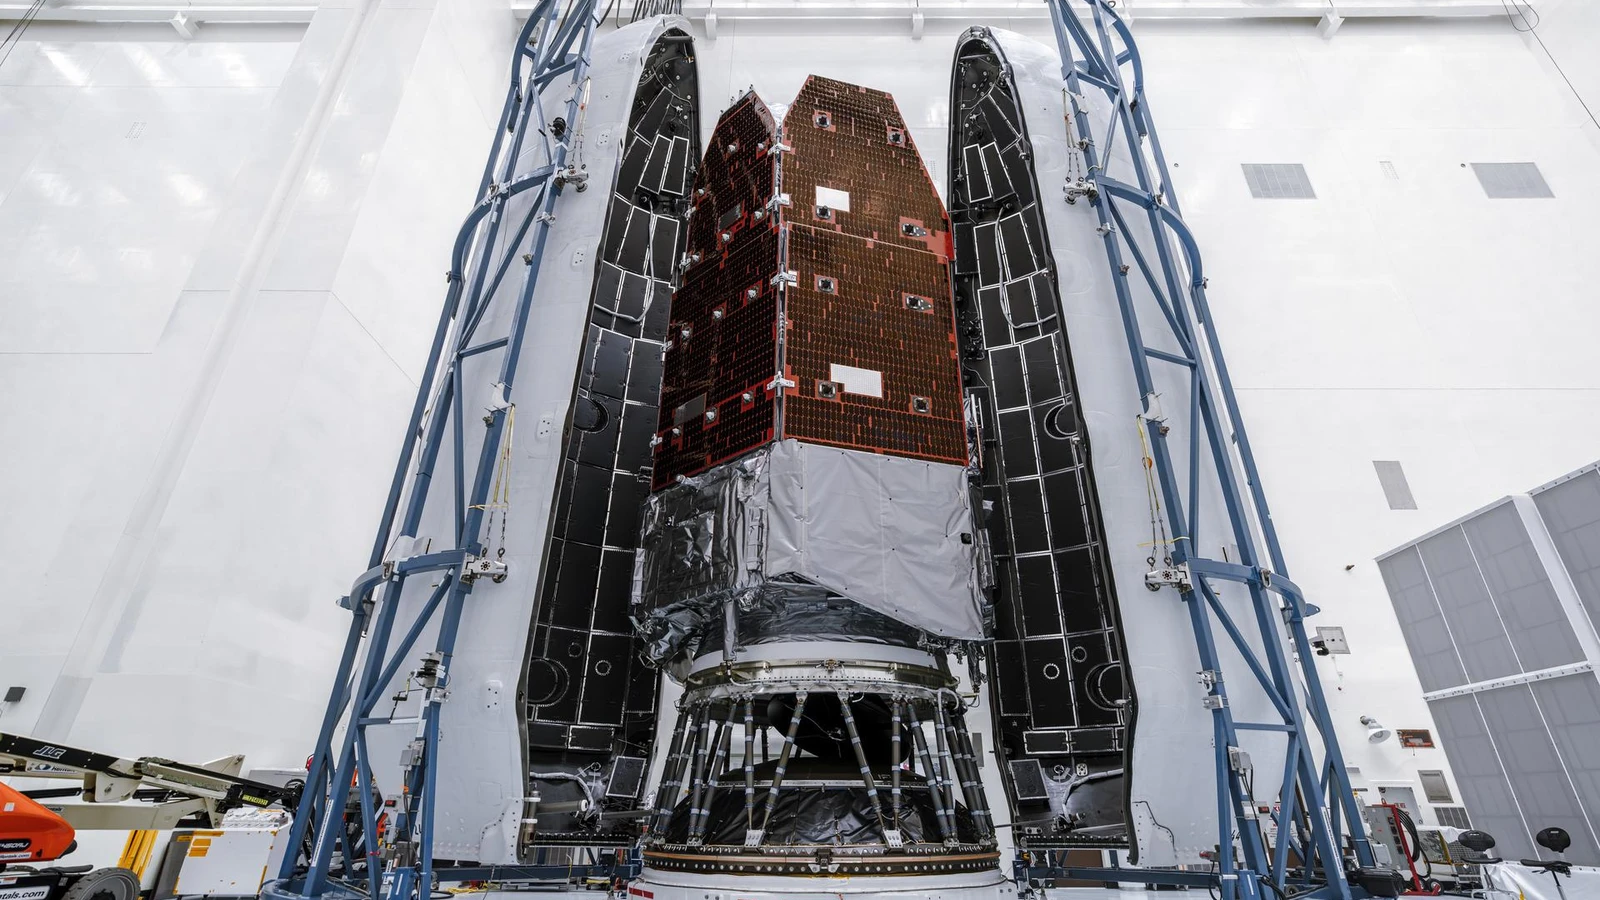
NASA's Roman observatory is sealed inside a Falcon Heavy fairing before launch. Here is what the shell protects during ascent—and what it cannot do after separation.
World Explained · Space and astronomy
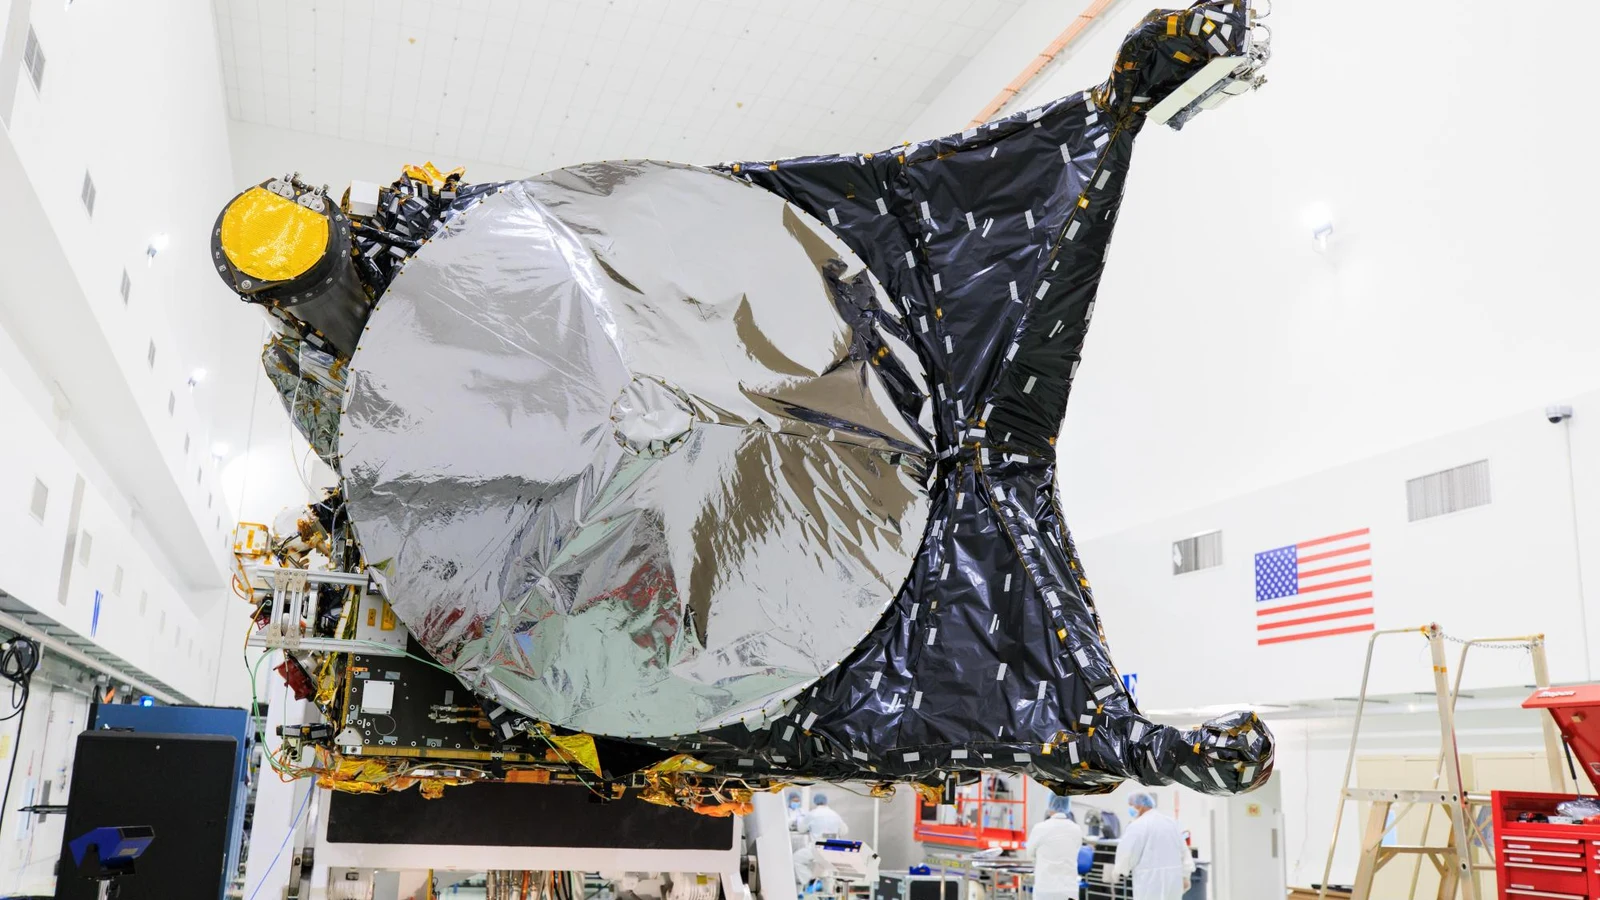
NASA's Psyche will combine images, elemental spectra, magnetic signals and gravity tracking to test what the unusual asteroid contains.
World Explained · Space and astronomy
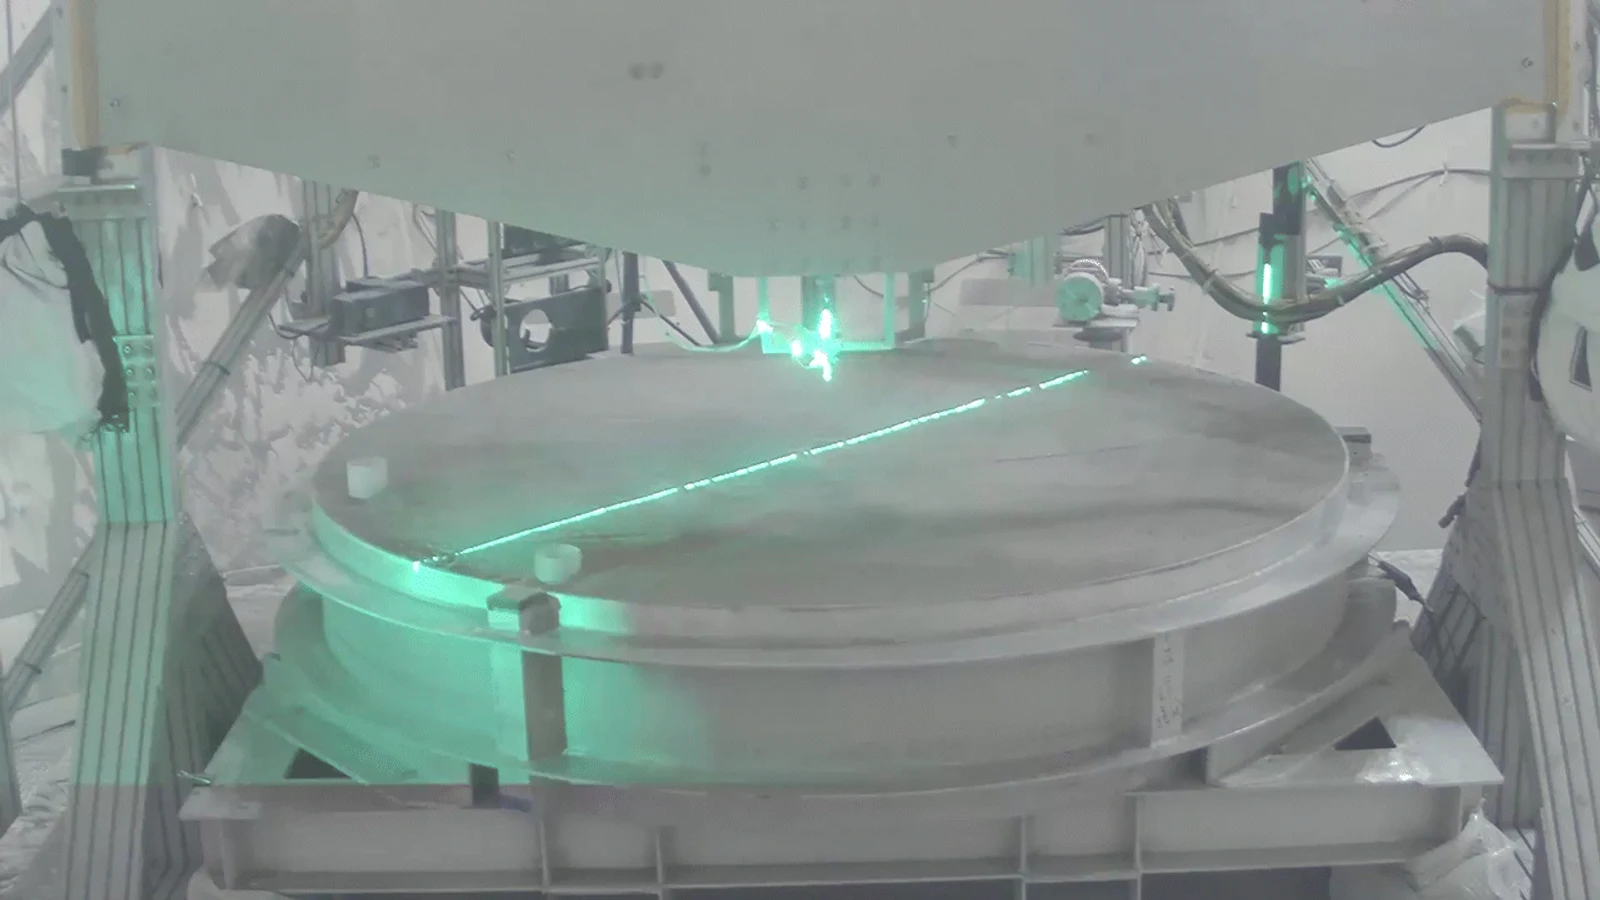
NASA's lunar plume tests use a vacuum chamber, simulated regolith and cameras to measure how exhaust moves the surface—before a future landing has to face it.
World Explained · Space and astronomy
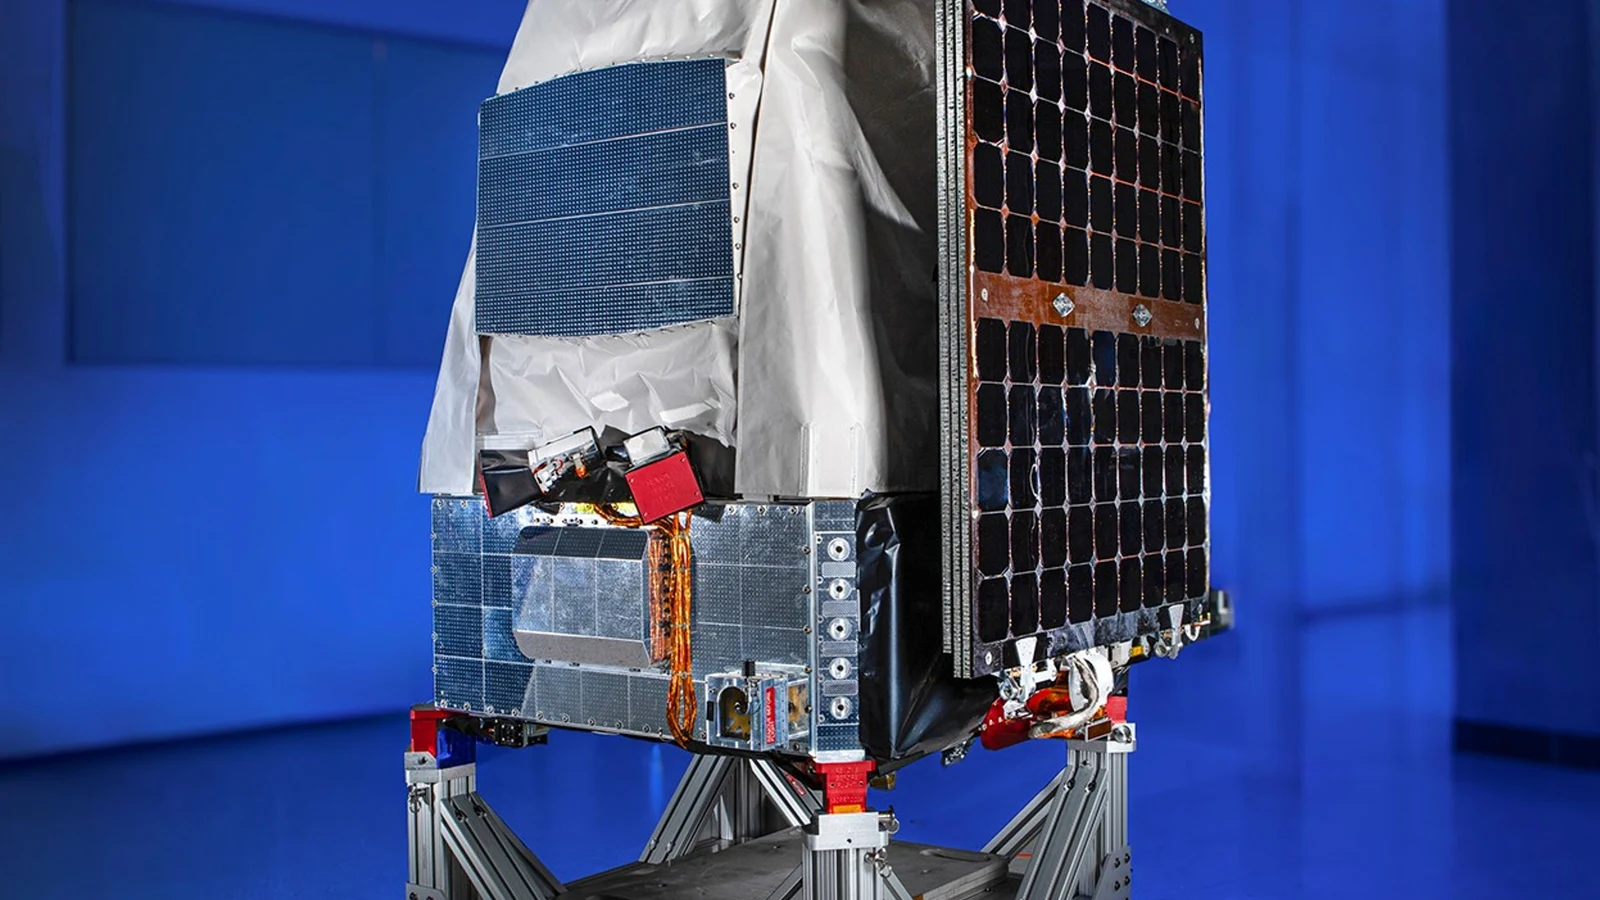
NASA's Pandora satellite pairs visible starlight with near-infrared spectra to separate host-star activity from exoplanet atmosphere signals.
World Explained · Earth and environment
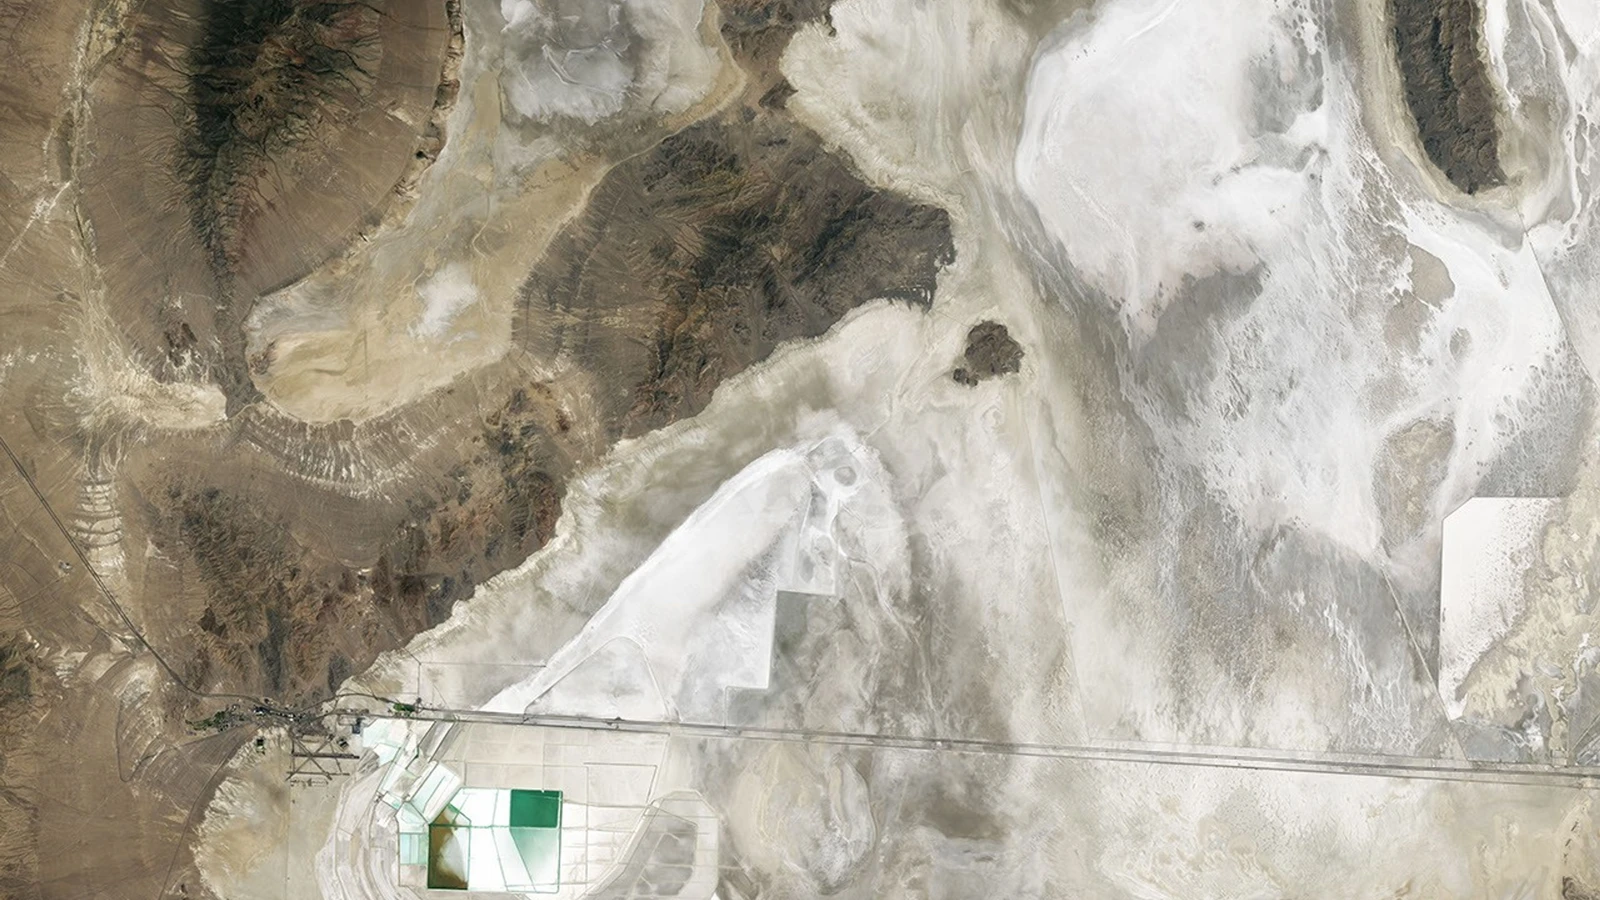
A Landsat image still shows the shorelines of ancient Lake Bonneville. Here's how a vanished lake became a map—and an Earth test for planetary cameras.
World Explained · Space and astronomy
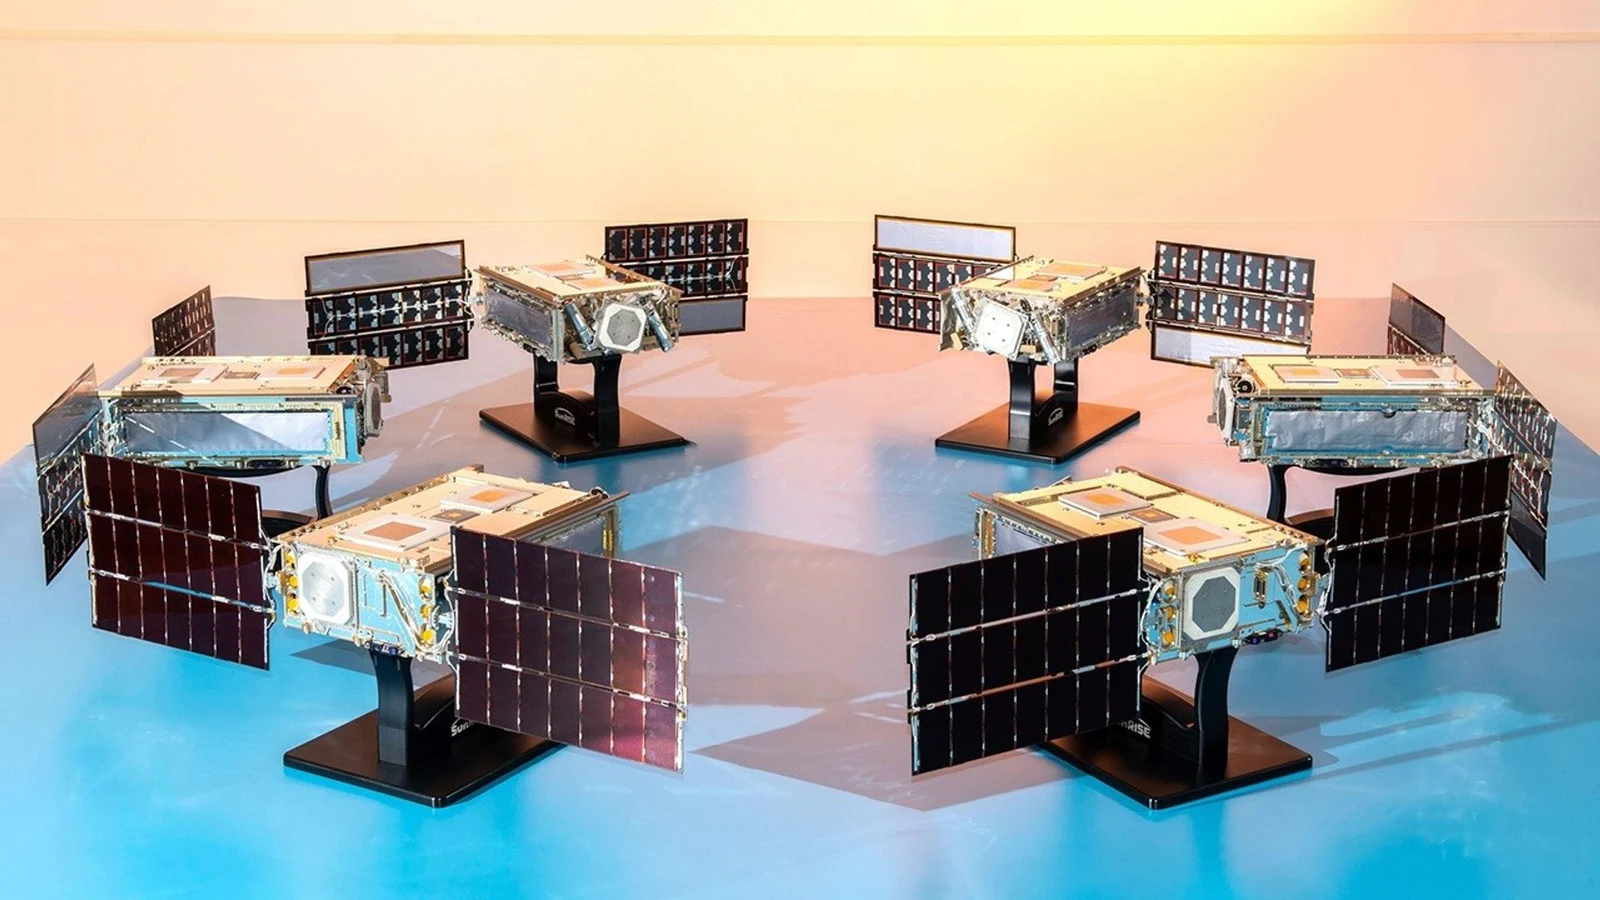
NASA's SunRISE will combine six small spacecraft as one radio interferometer to locate solar radio bursts linked to space-weather particle storms.

World Explained · Space and astronomy
Comet 220P brightened dramatically in 2026. Here is how astronomers compare brightness, coma and tails to identify an outburst without guessing its cause.
World Explained · Earth and climate
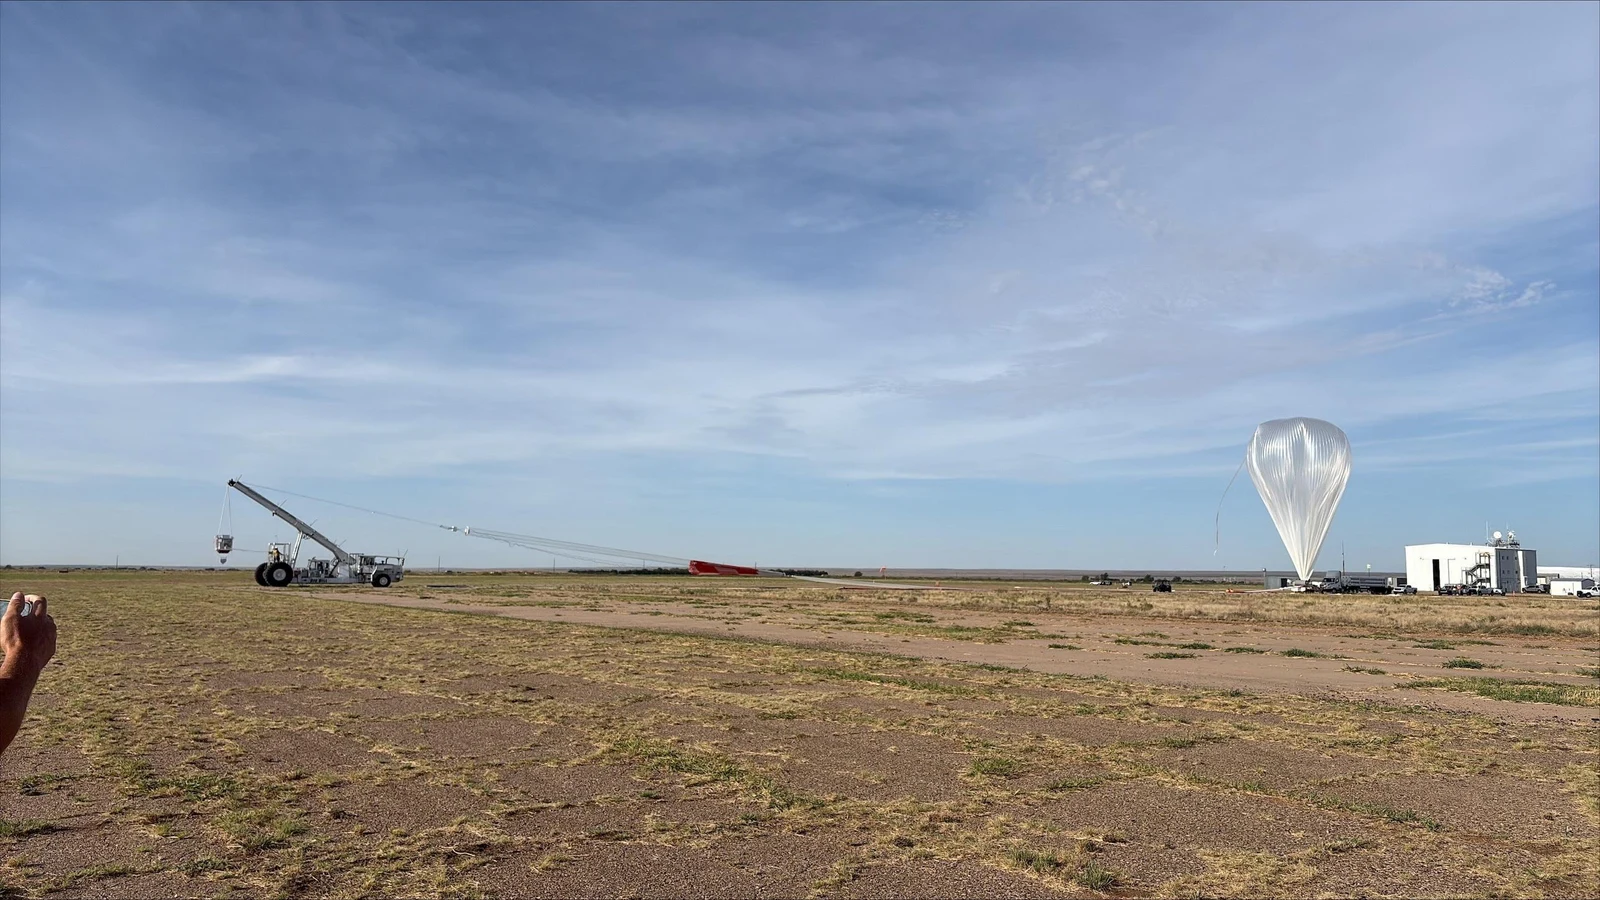
NASA's Fort Sumner balloons turn changing altitude into atmospheric data. Here is how the sensor chain works—and why one flight is not a global climate result.
World Explained · Space and astronomy
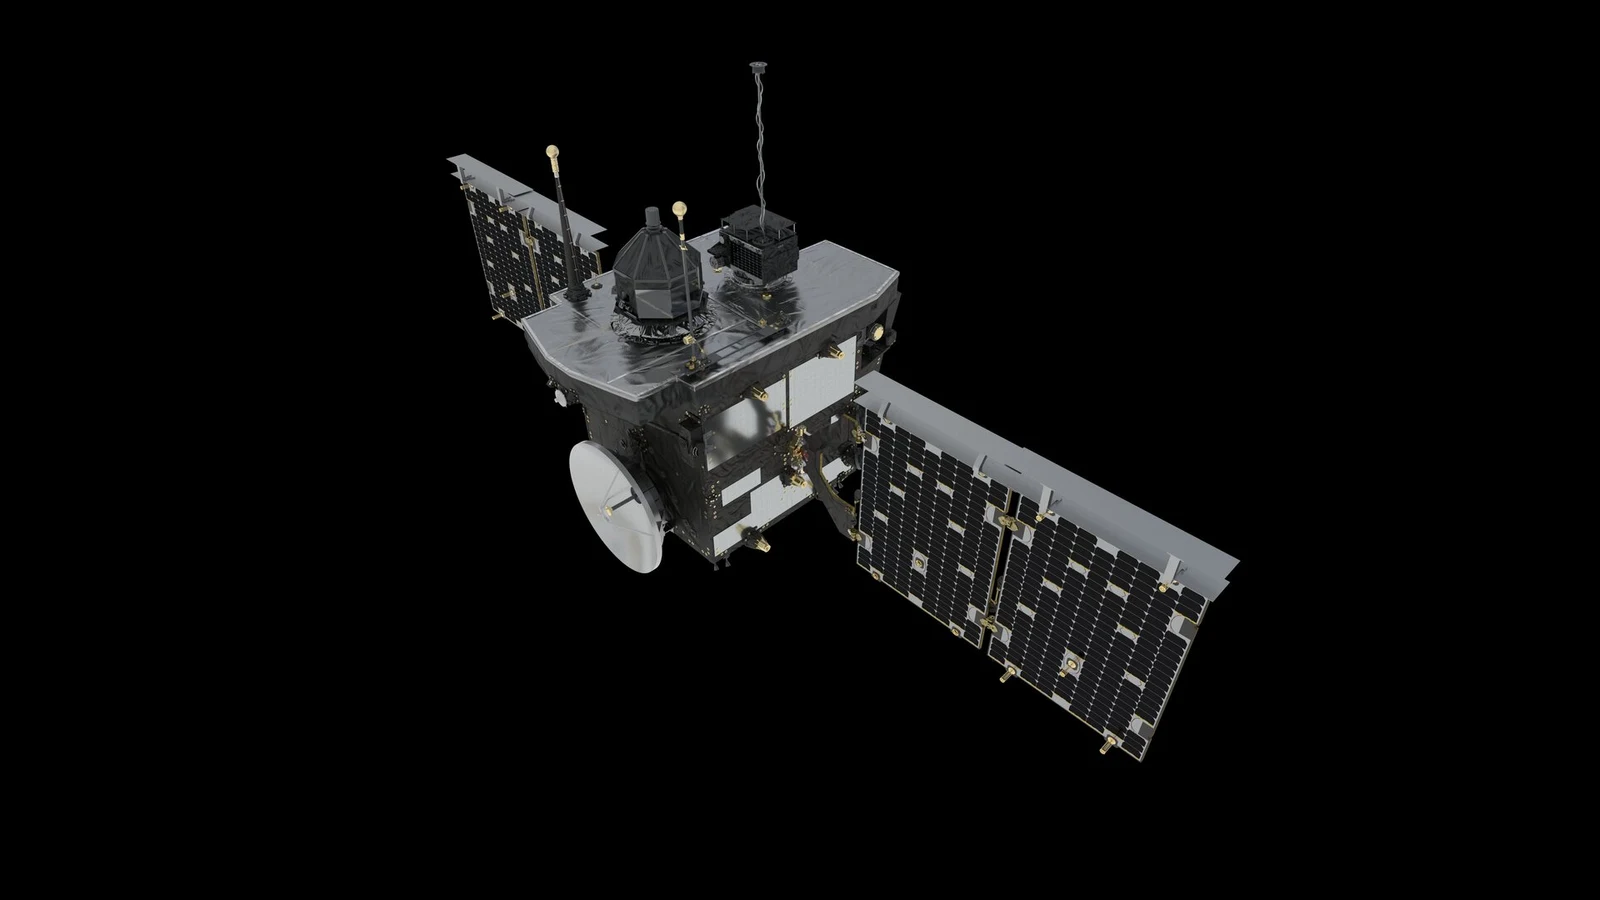
ESA's Comet Interceptor will release two probes around a future comet. This is how simultaneous viewpoints could turn a fast flyby into a 3D profile.
World Explained · Space and astronomy
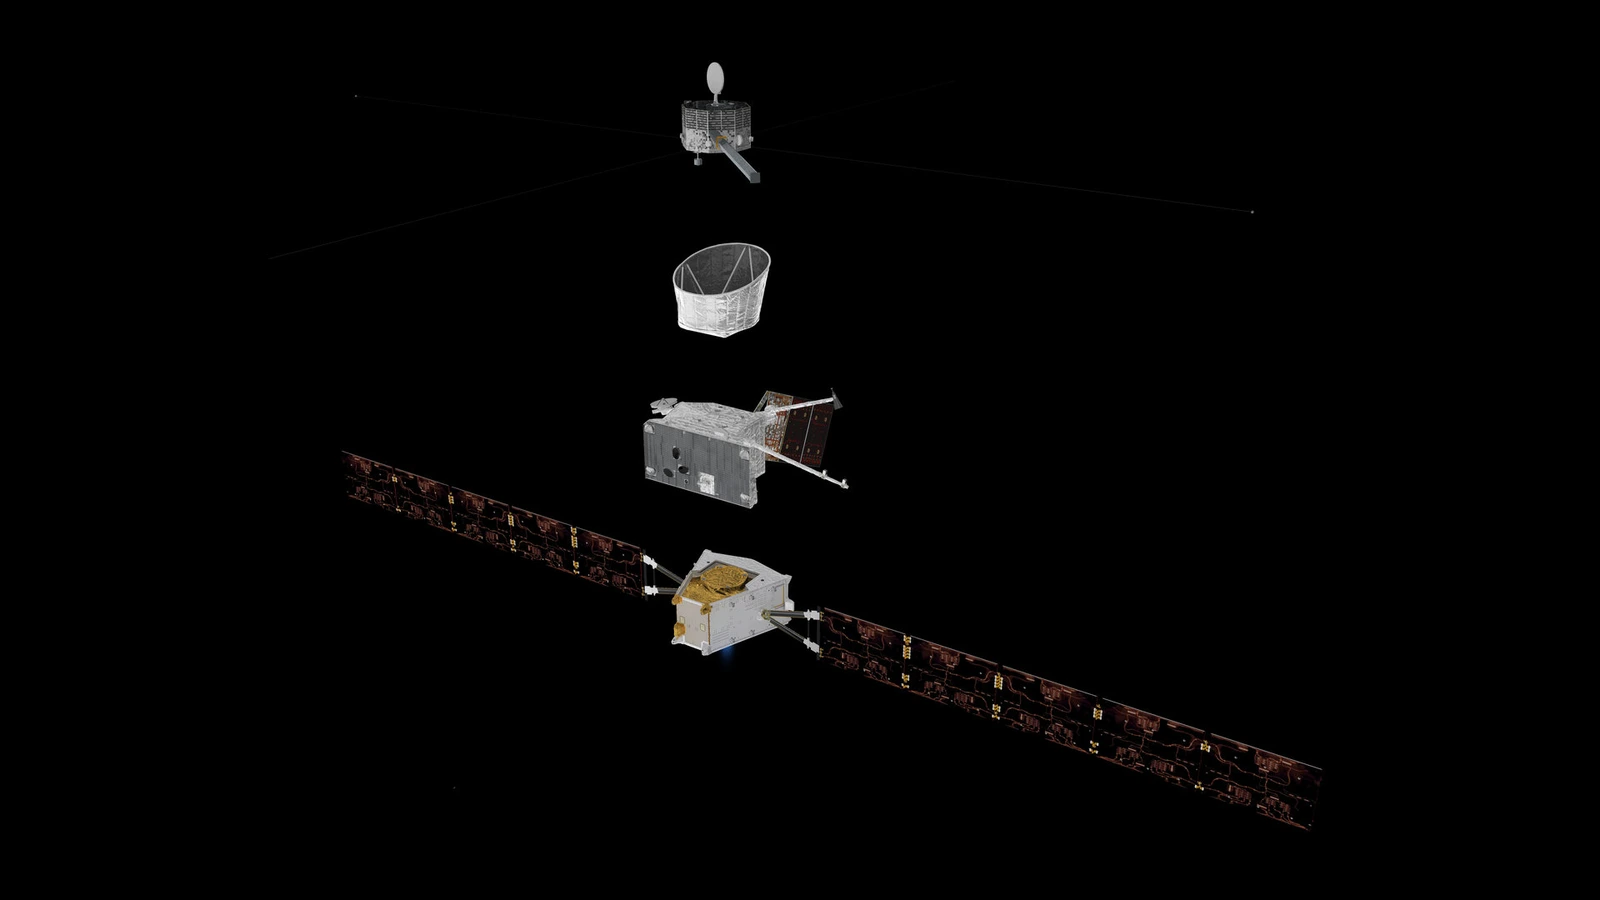
BepiColombo will not fly straight to Mercury. Its planned arrival uses a composite spacecraft, final separation and staged burns to place two orbiters around the hot planet.
World Explained · Space and technology
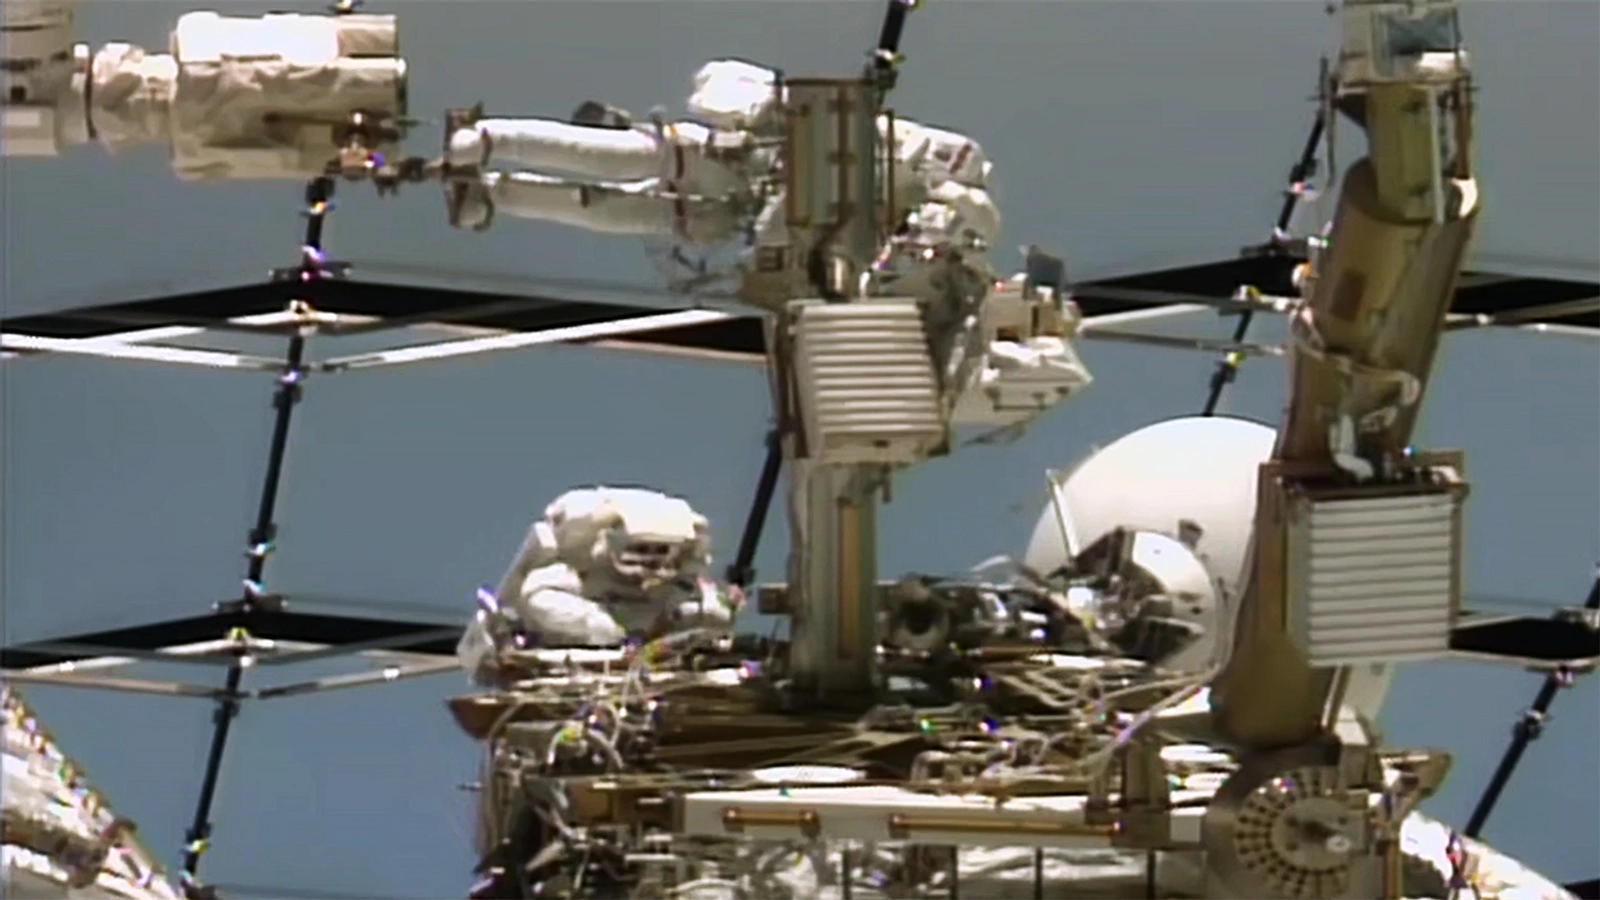
One ISS antenna stopped tracking relay satellites. The planned August 25 spacewalk shows how a spare can restore high-rate communications redundancy without implying outage.
World Explained · Space and astronomy
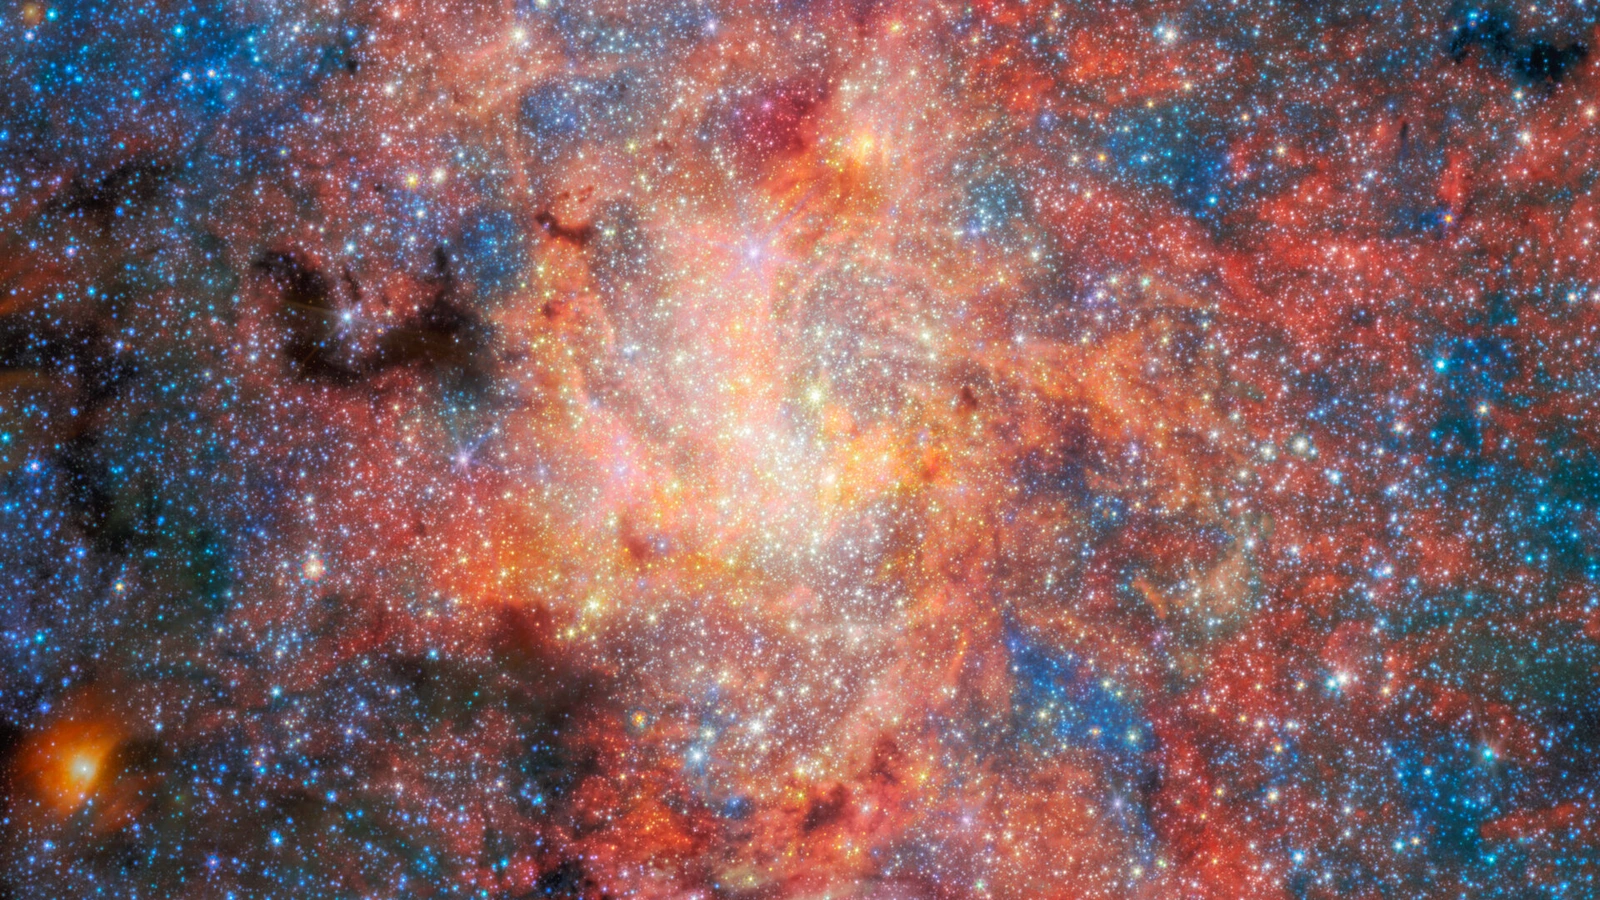
Webb's infrared spectrum found oxygen-rich dust and water absorption signs around IRS 3, a dying star near Sagittarius A*. What the evidence does, and does not, show.
World Explained · Space and astronomy
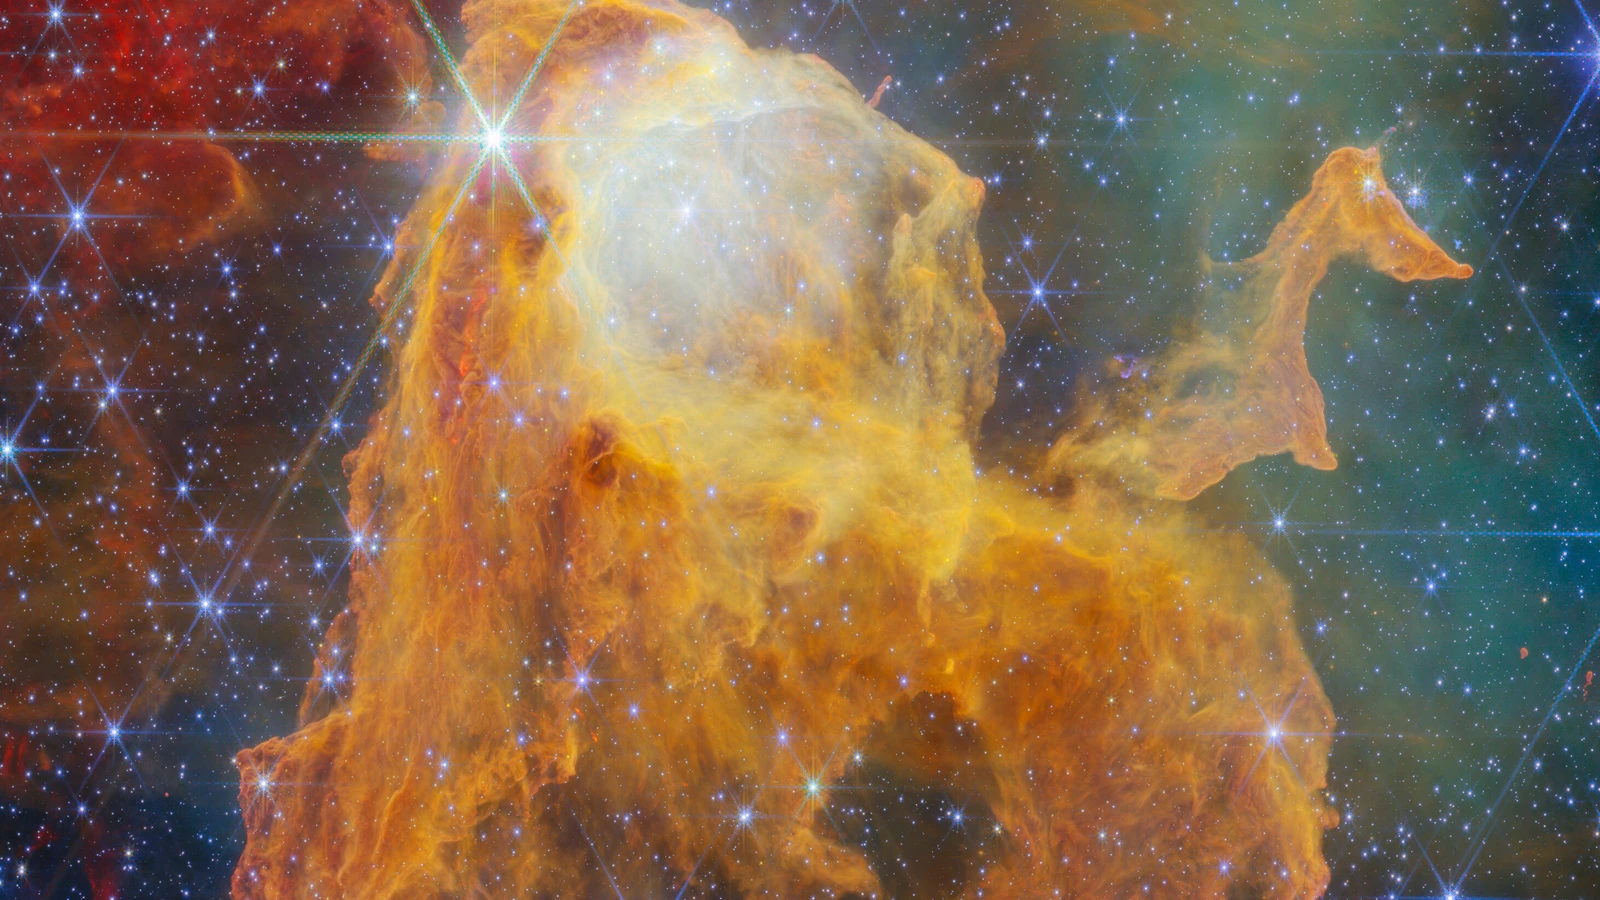
Webb's Carina image is an infrared map of a dusty star-forming globule. Here is what its structure shows, and what the glow cannot prove.
World Explained · Space and astronomy
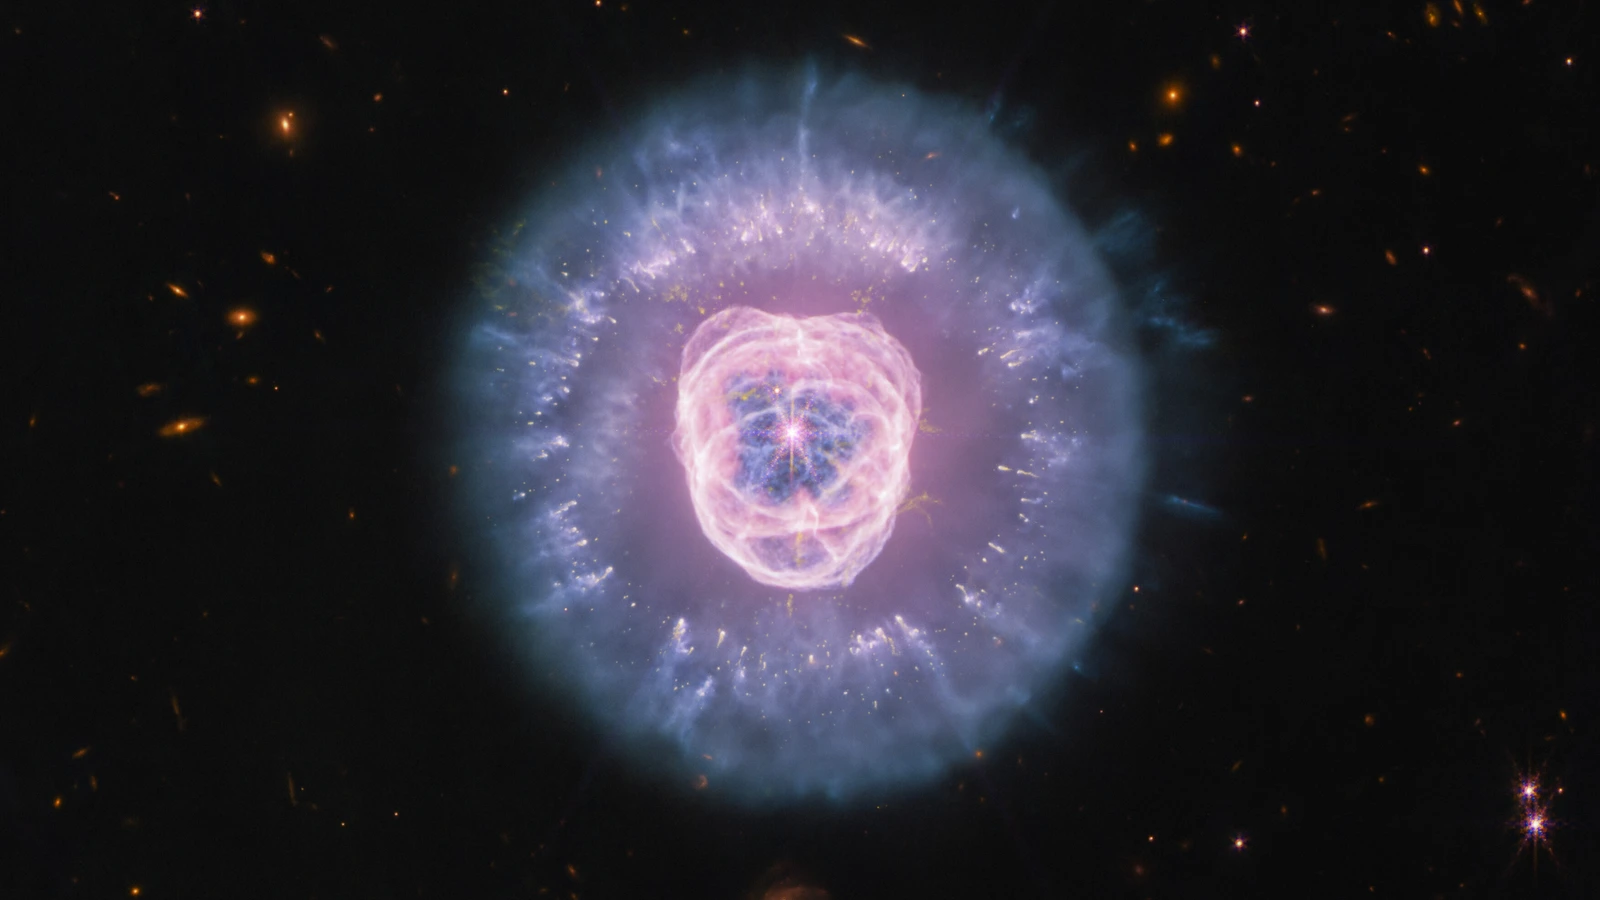
Webb's NIRCam and MIRI show why the same dying-star nebula changes across infrared wavelengths, and what its processed colours can and cannot prove.
World Explained · Space and technology
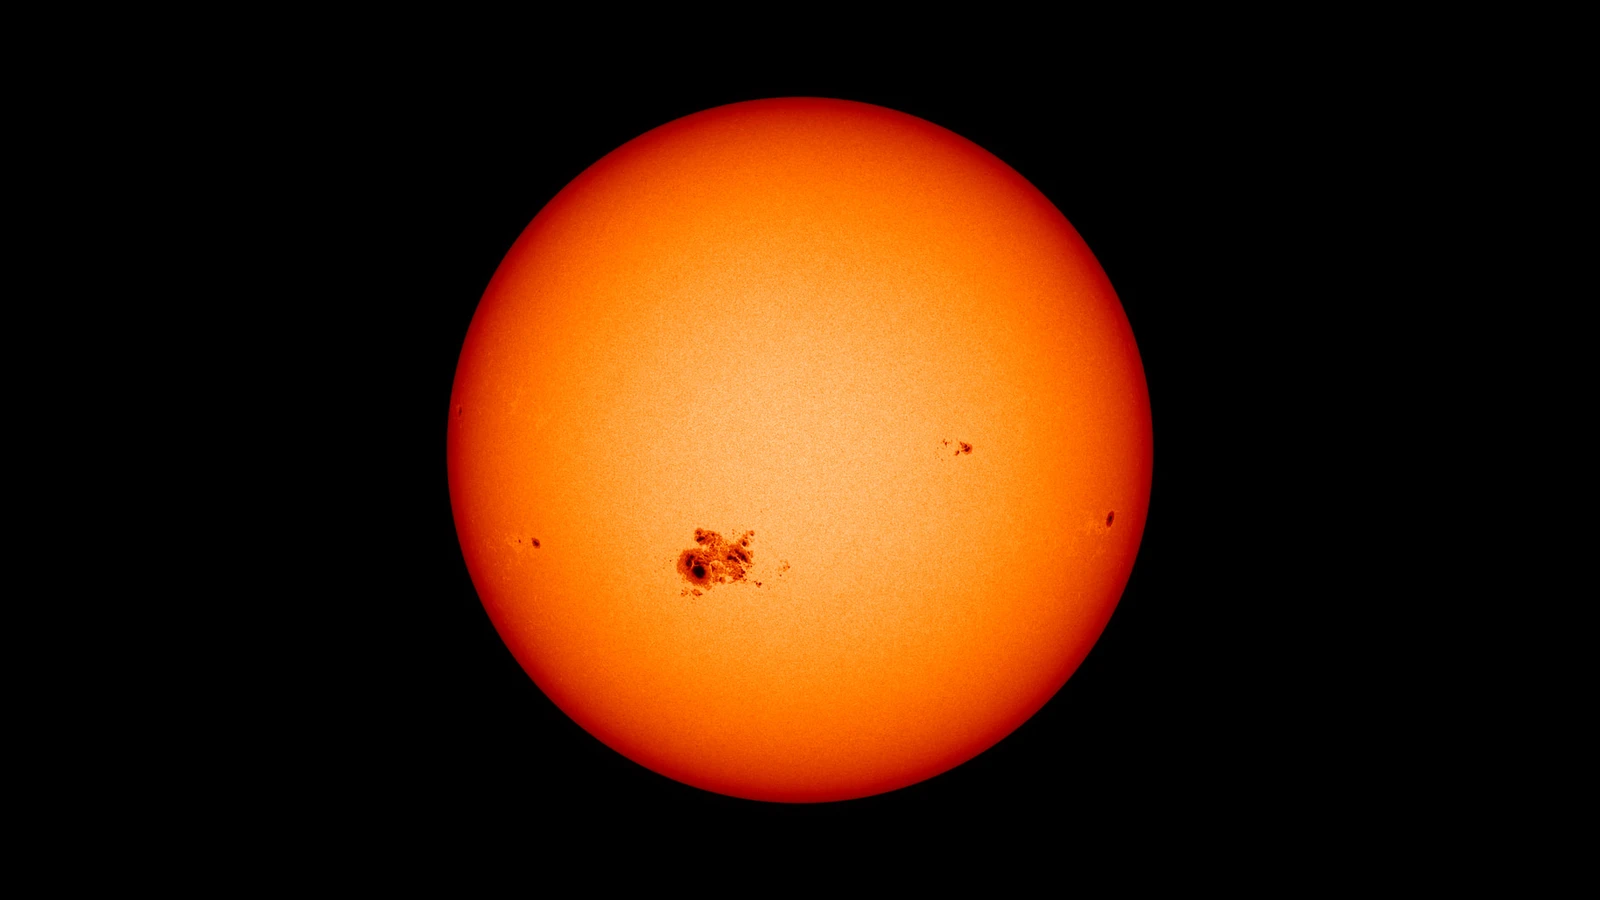
A NASA-backed Transformer looks for faint SDO/HMI changes before an active region becomes visible. Here is what its 12-hour test shows—and why it is not a flare forecast.
World Explained · Space
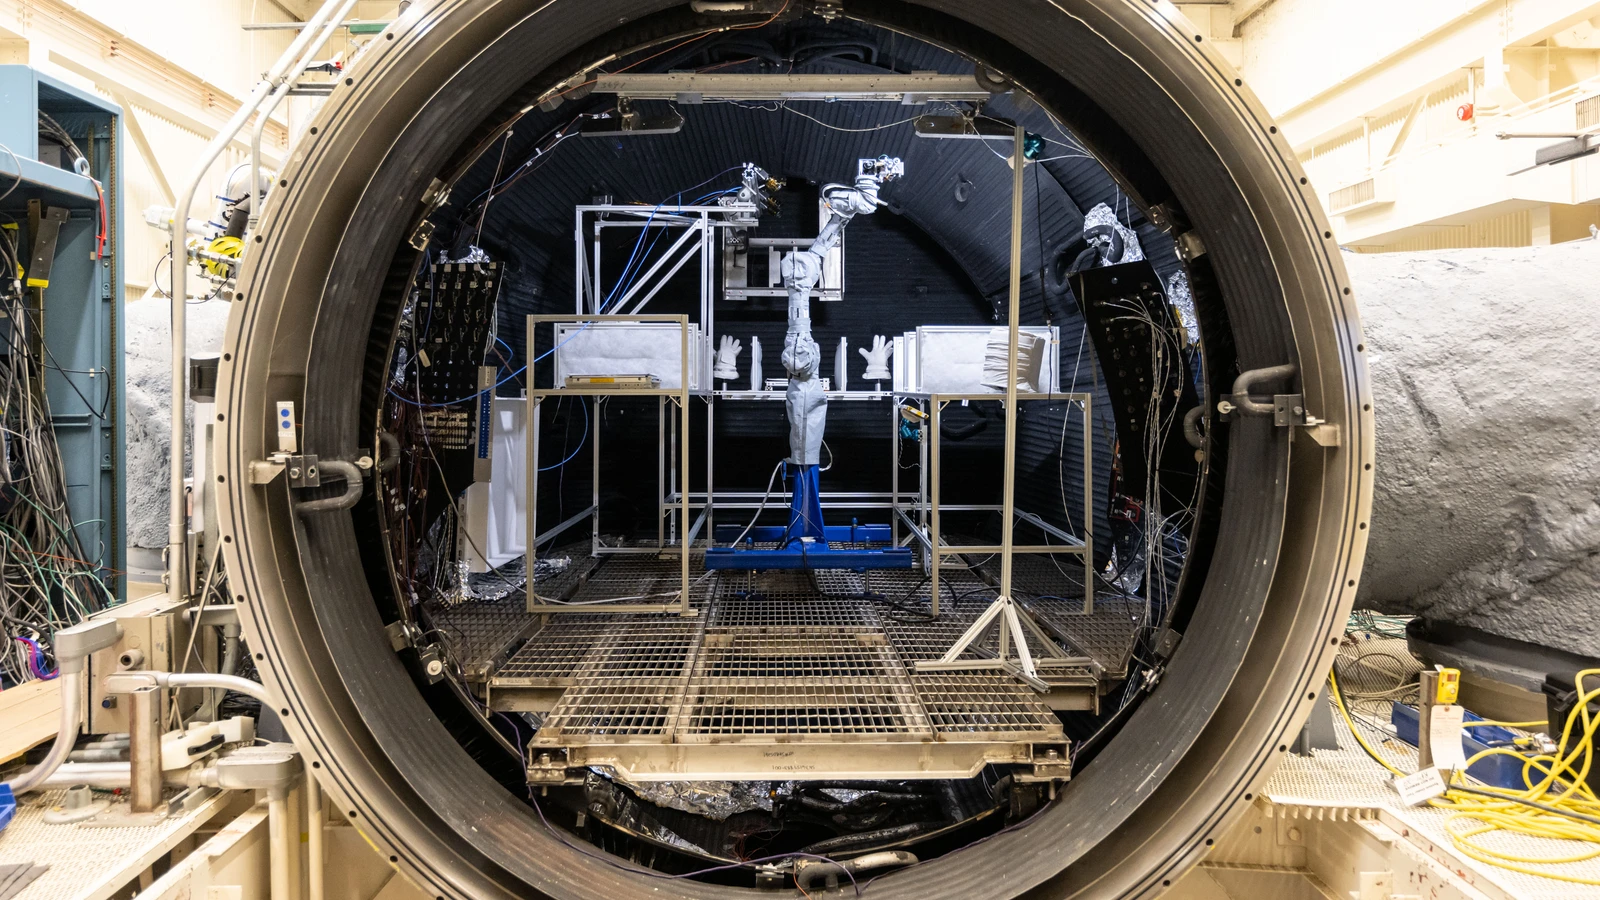
NASA uses lunar-soil simulant, vacuum, temperature swings and controlled dust exposure to test hardware on Earth—useful evidence, but not a miniature Moon.
World Explained · Space
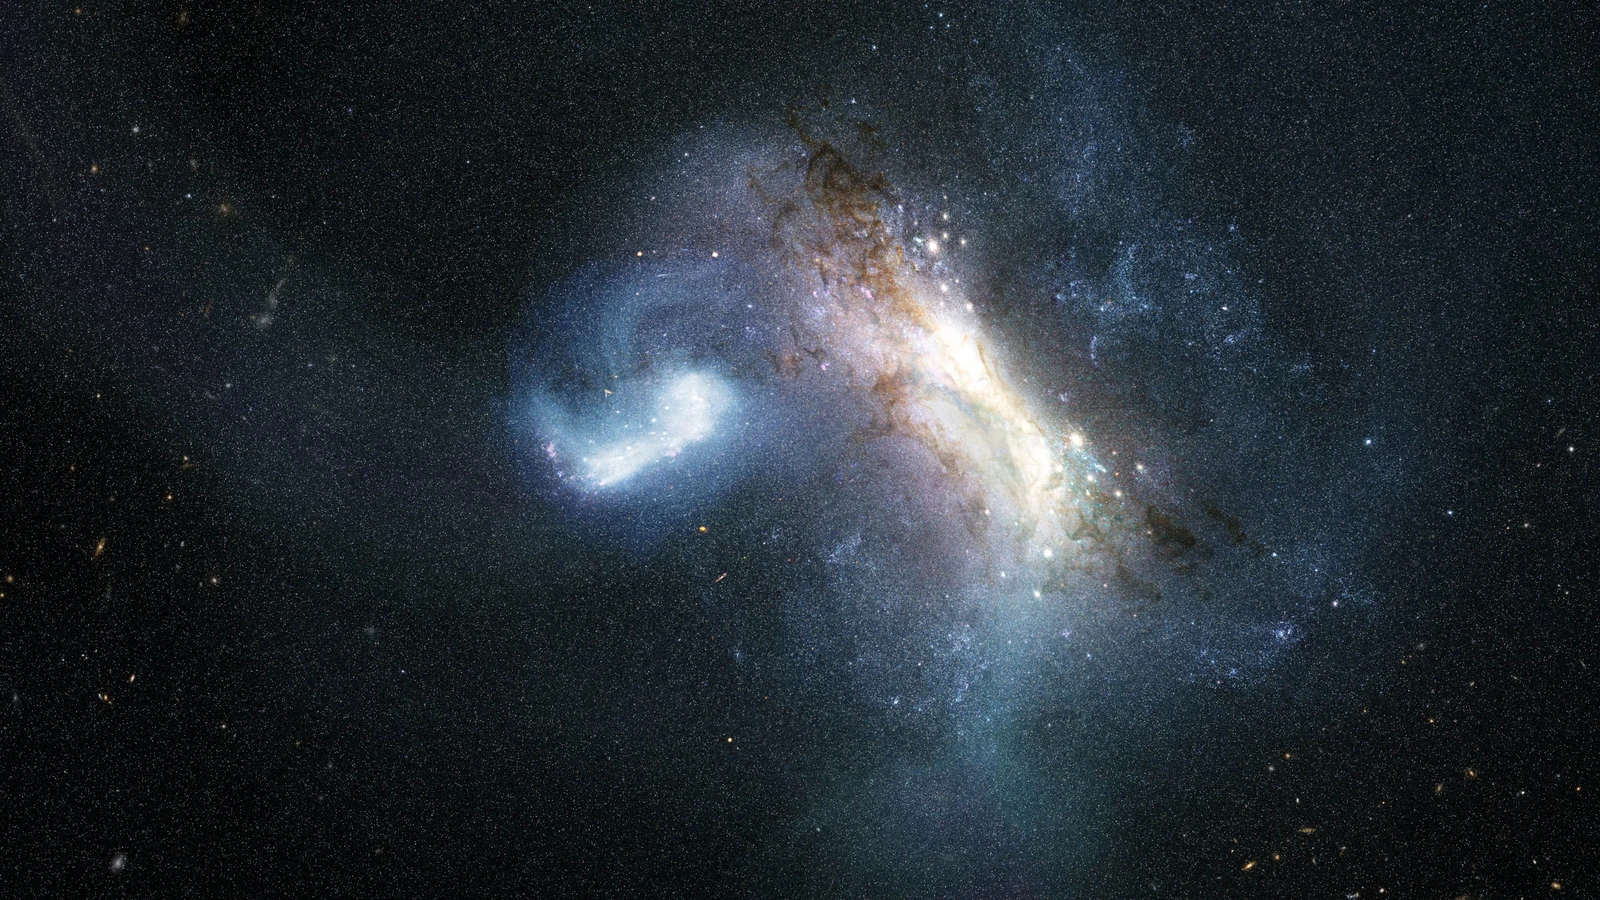
Hubble and Gaia used ancient cluster ages, chemistry and motion to reconstruct an early Milky Way merger—without photographing the collision.
World Explained · Space and technology
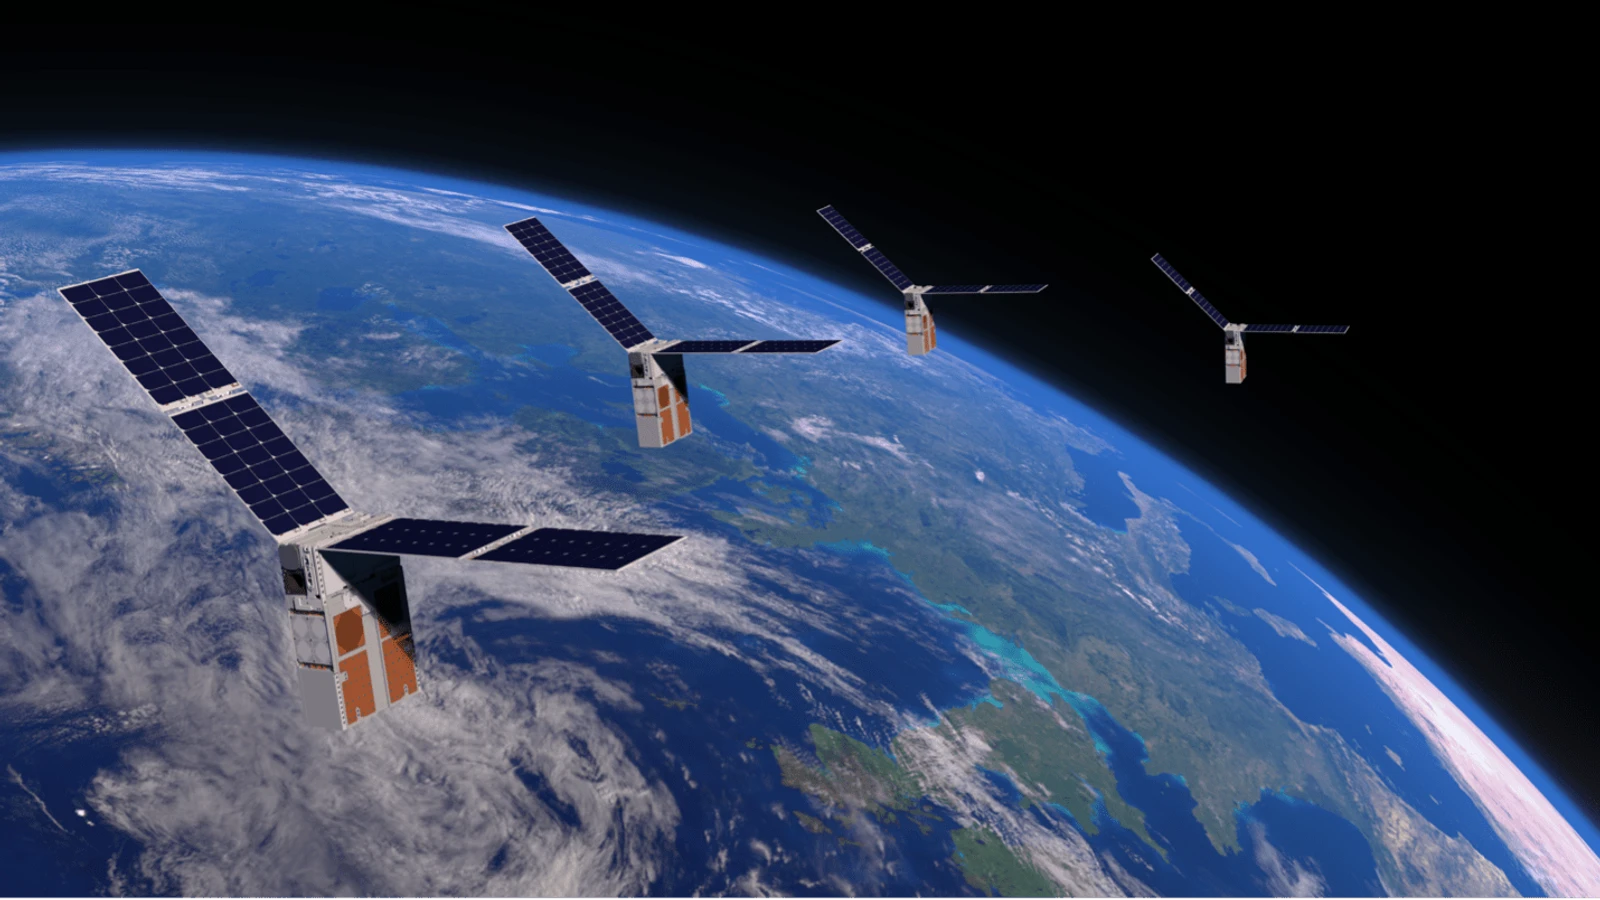
NASA's FALCON demonstration used Starling's cameras and a catalogue of known space objects to estimate orbits, showing a method without claiming universal GPS replacement.
World Explained · Earth and environment
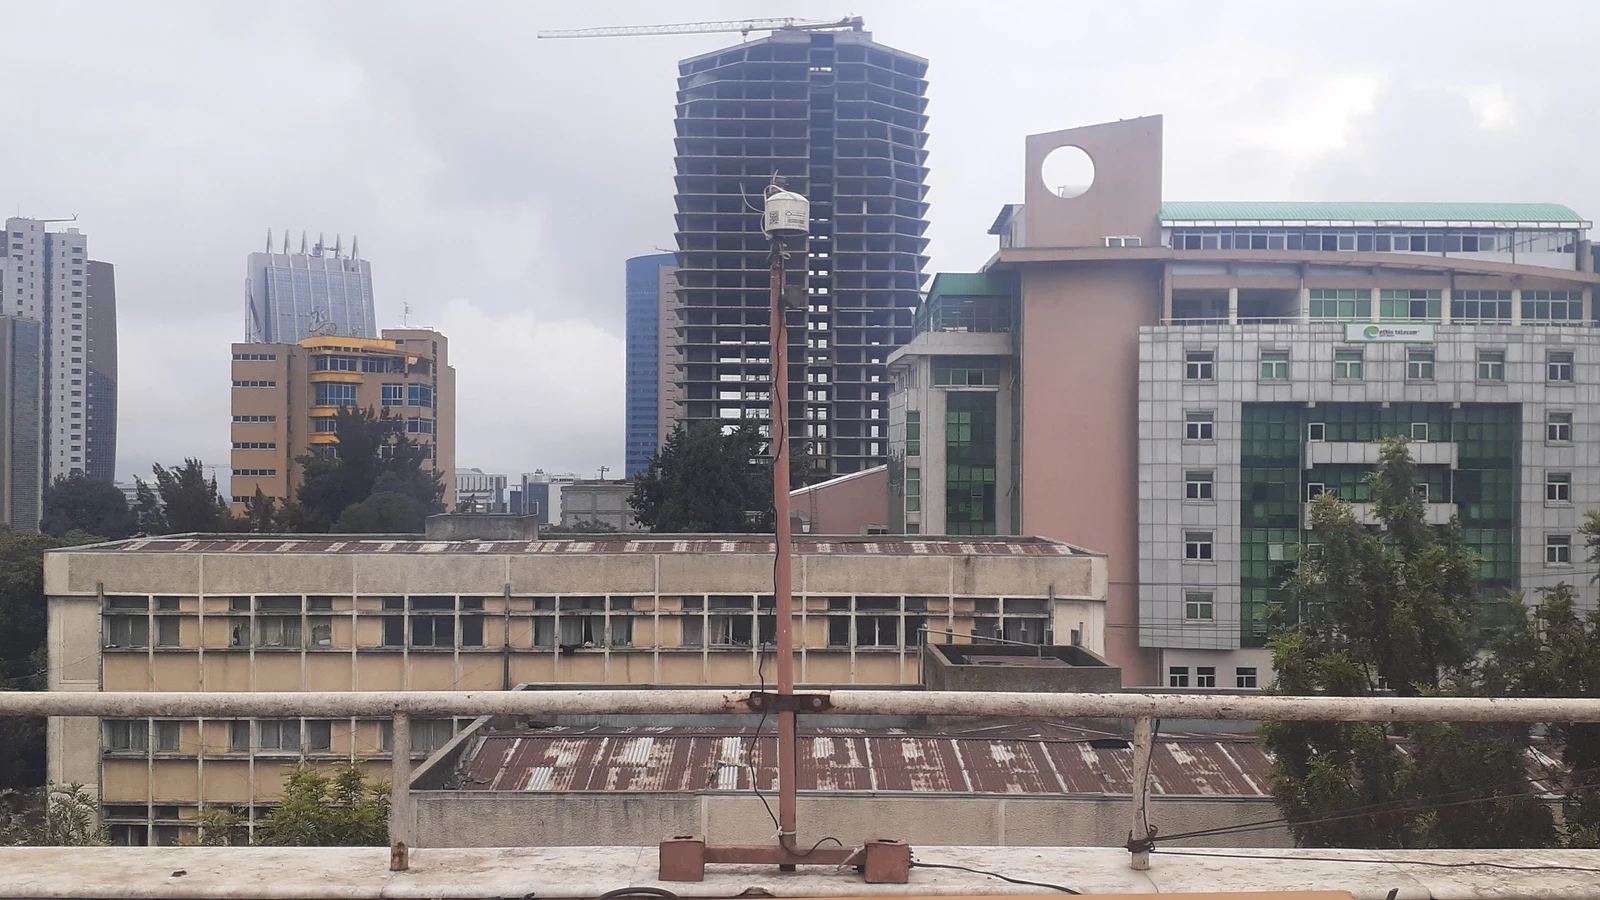
A three-year Addis Ababa monitoring network combines PM2.5, black carbon, timing and air-mass trajectories to narrow source patterns without turning a model into a health verdict.
World Explained · Space and technology
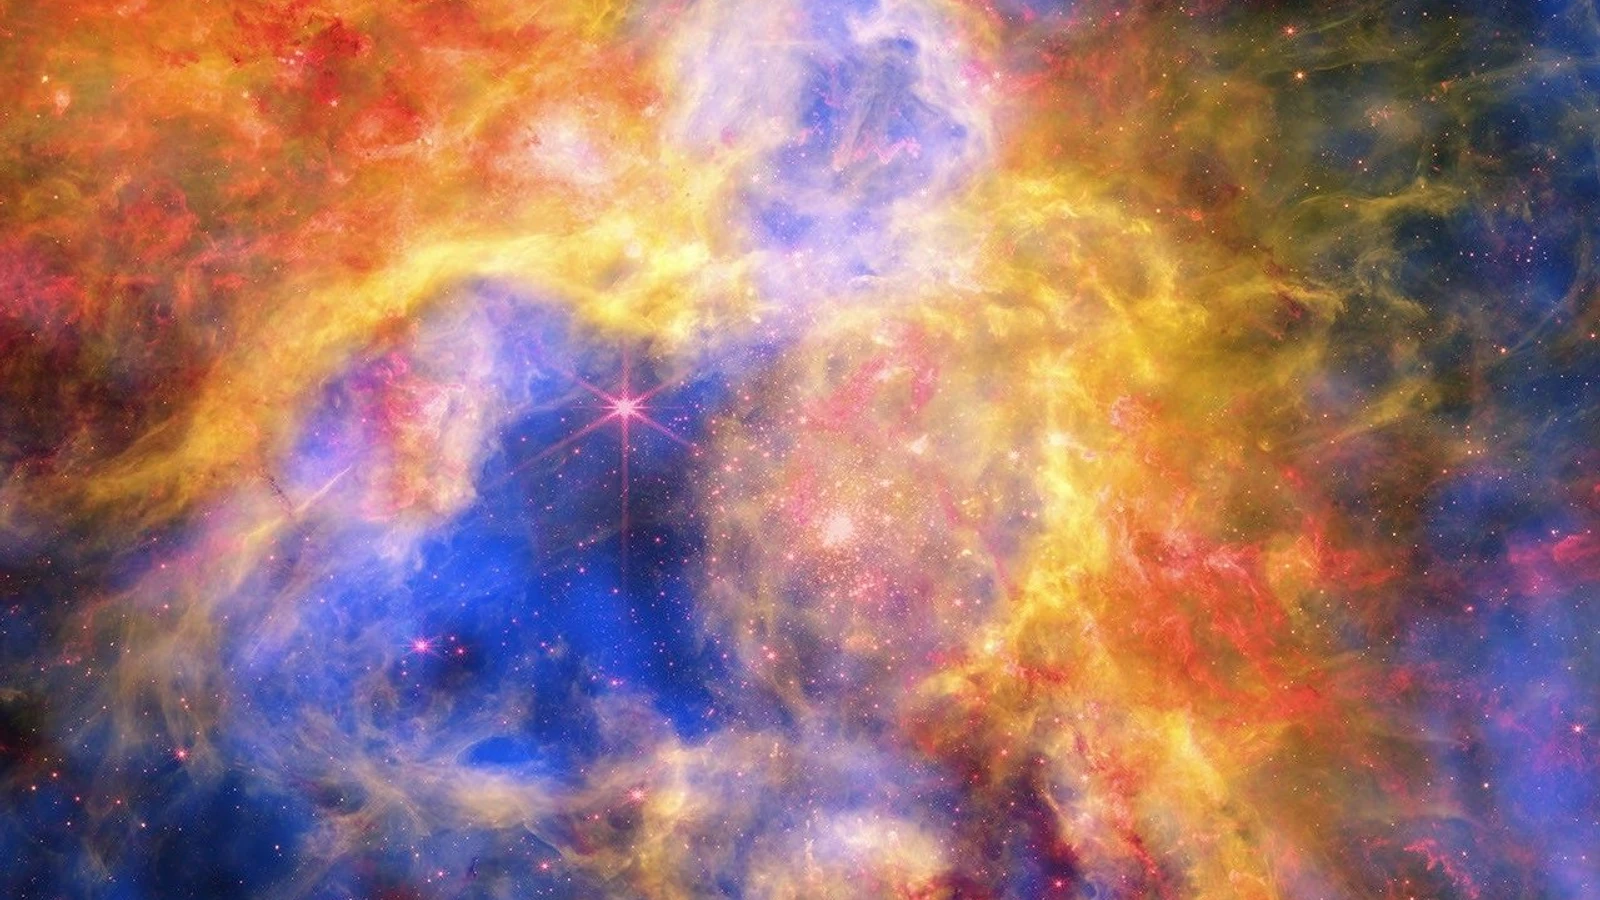
The Tarantula Nebula composite is not one camera's view: Chandra, Webb and Hubble contribute different wavelength evidence that can be aligned and compared.
World Explained · Space and astronomy
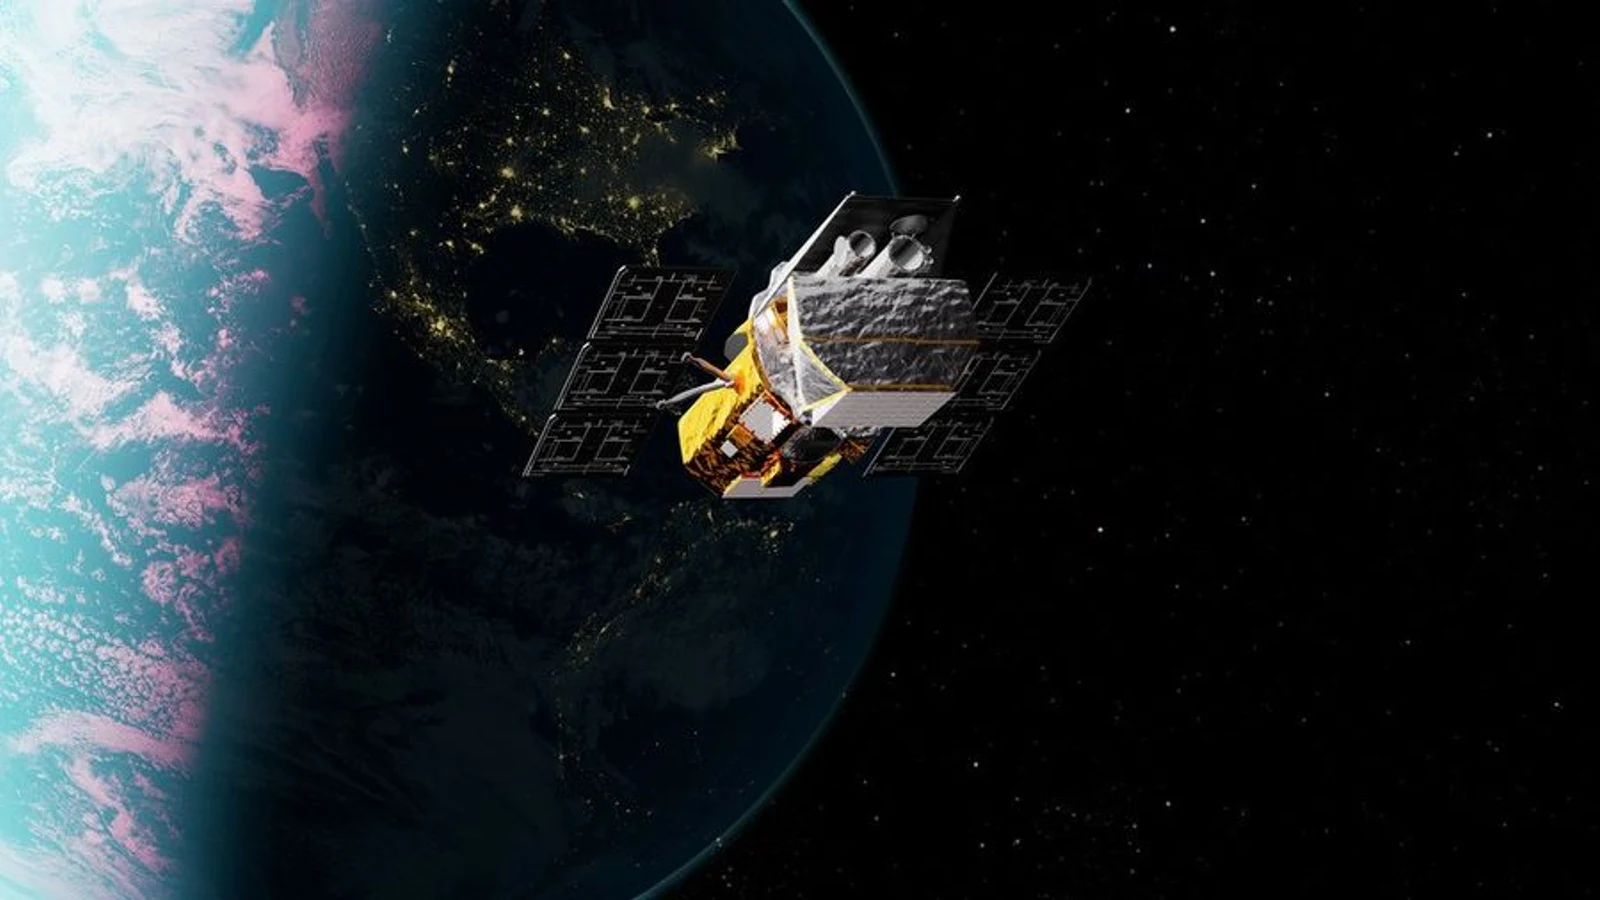
Raising an observatory's orbit takes carefully timed velocity changes and a safe rendezvous. NASA's Swift mission shows why the mechanics and status must stay separate.
World Explained · Space and astronomy
ESA's Cluster re-entries show why a planned observation can improve breakup models without turning a future atmospheric event into a guaranteed experiment.
World Explained · Earth and climate
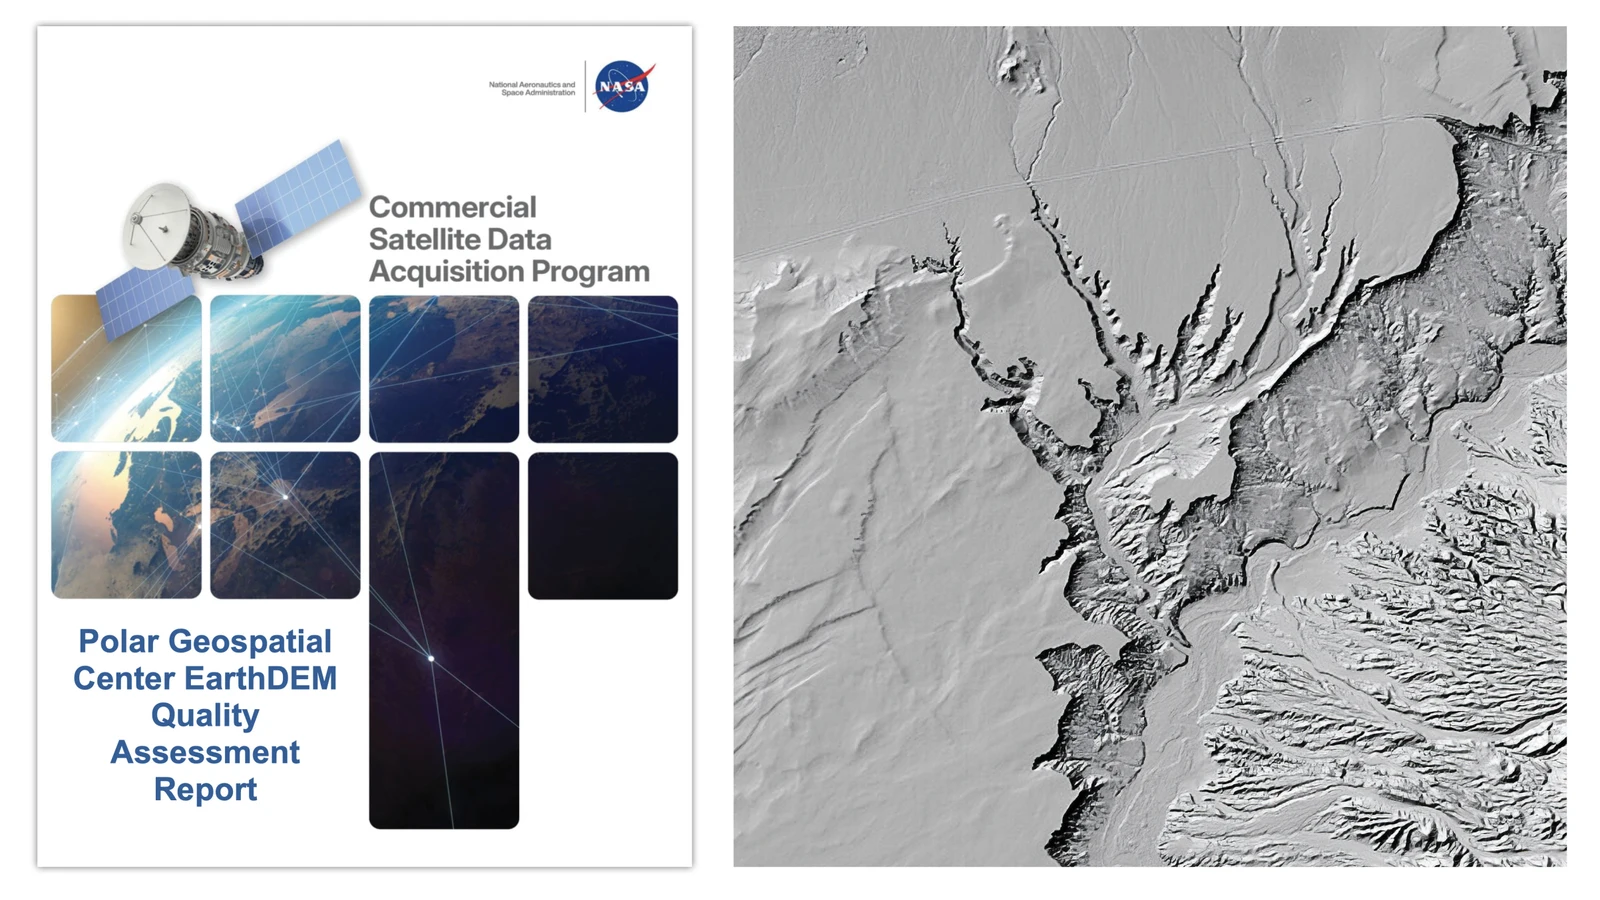
NASA's EarthDEM assessment shows how independent lidar checks separate map resolution, horizontal accuracy and vertical uncertainty.
World Explained · Space and astronomy
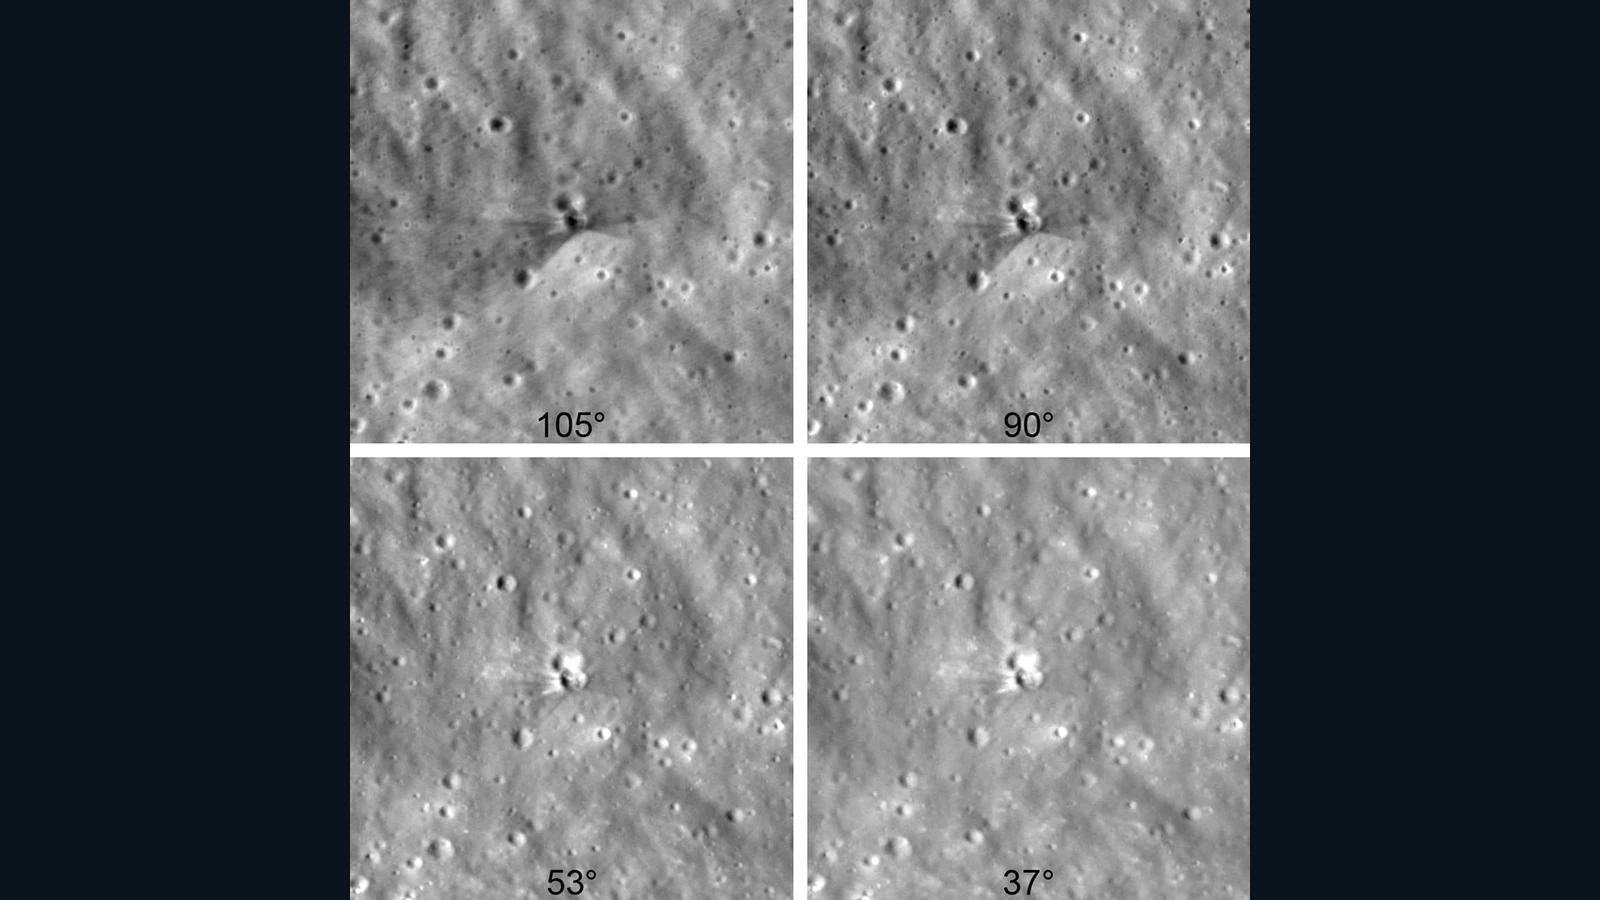
NASA's Falcon 9 lunar impact shows how trajectory predictions, timed spacecraft images and changing light turn a hidden event into evidence.
World Explained · Space and astronomy
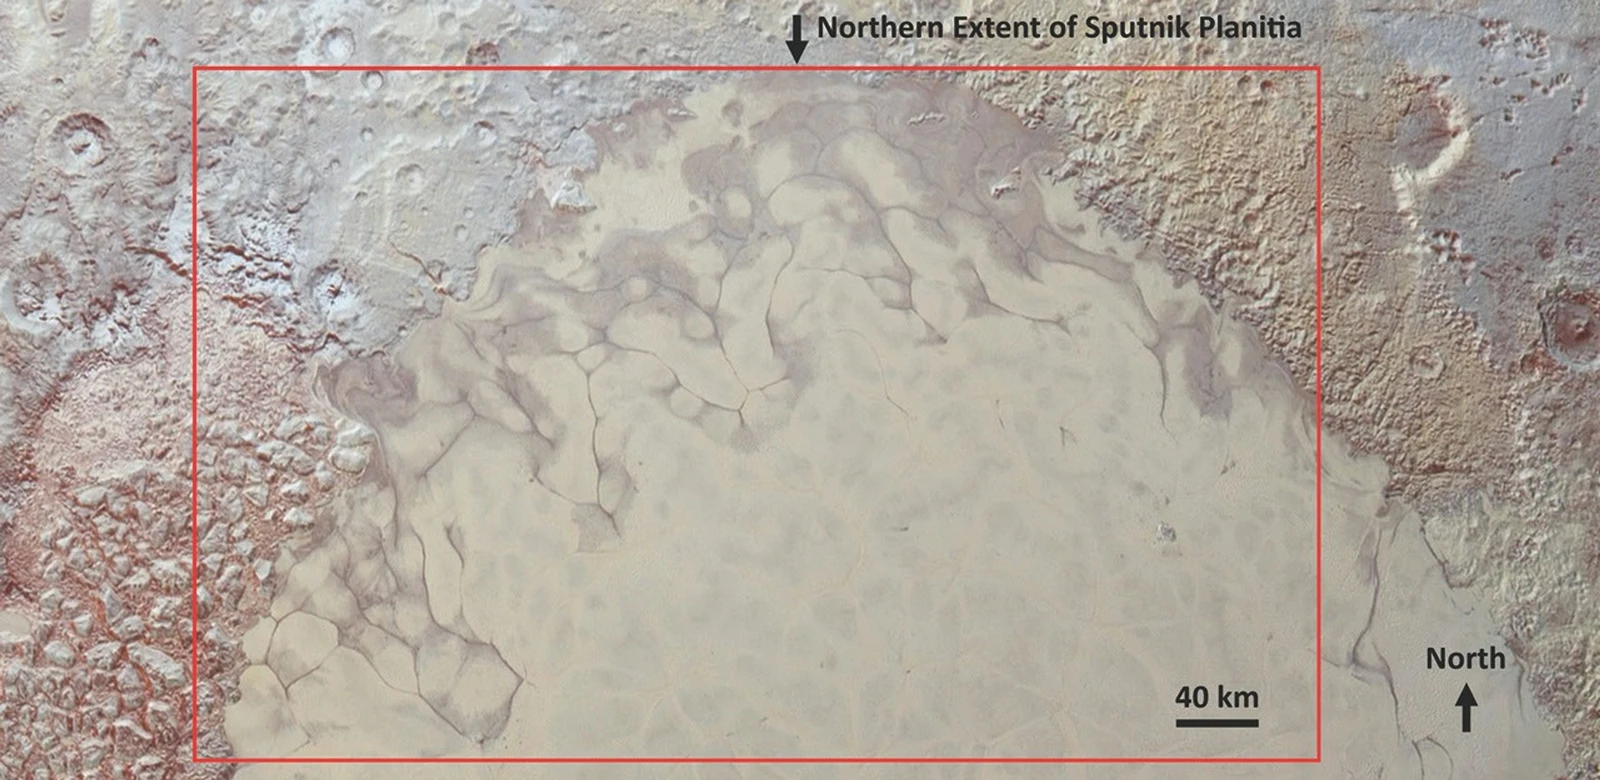
New Horizons images show dark patterns at Pluto's Sputnik Planitia, but a peer-reviewed hypothesis is not a direct liquid sample. Here is how the evidence fits together.
World Explained · Space and astronomy
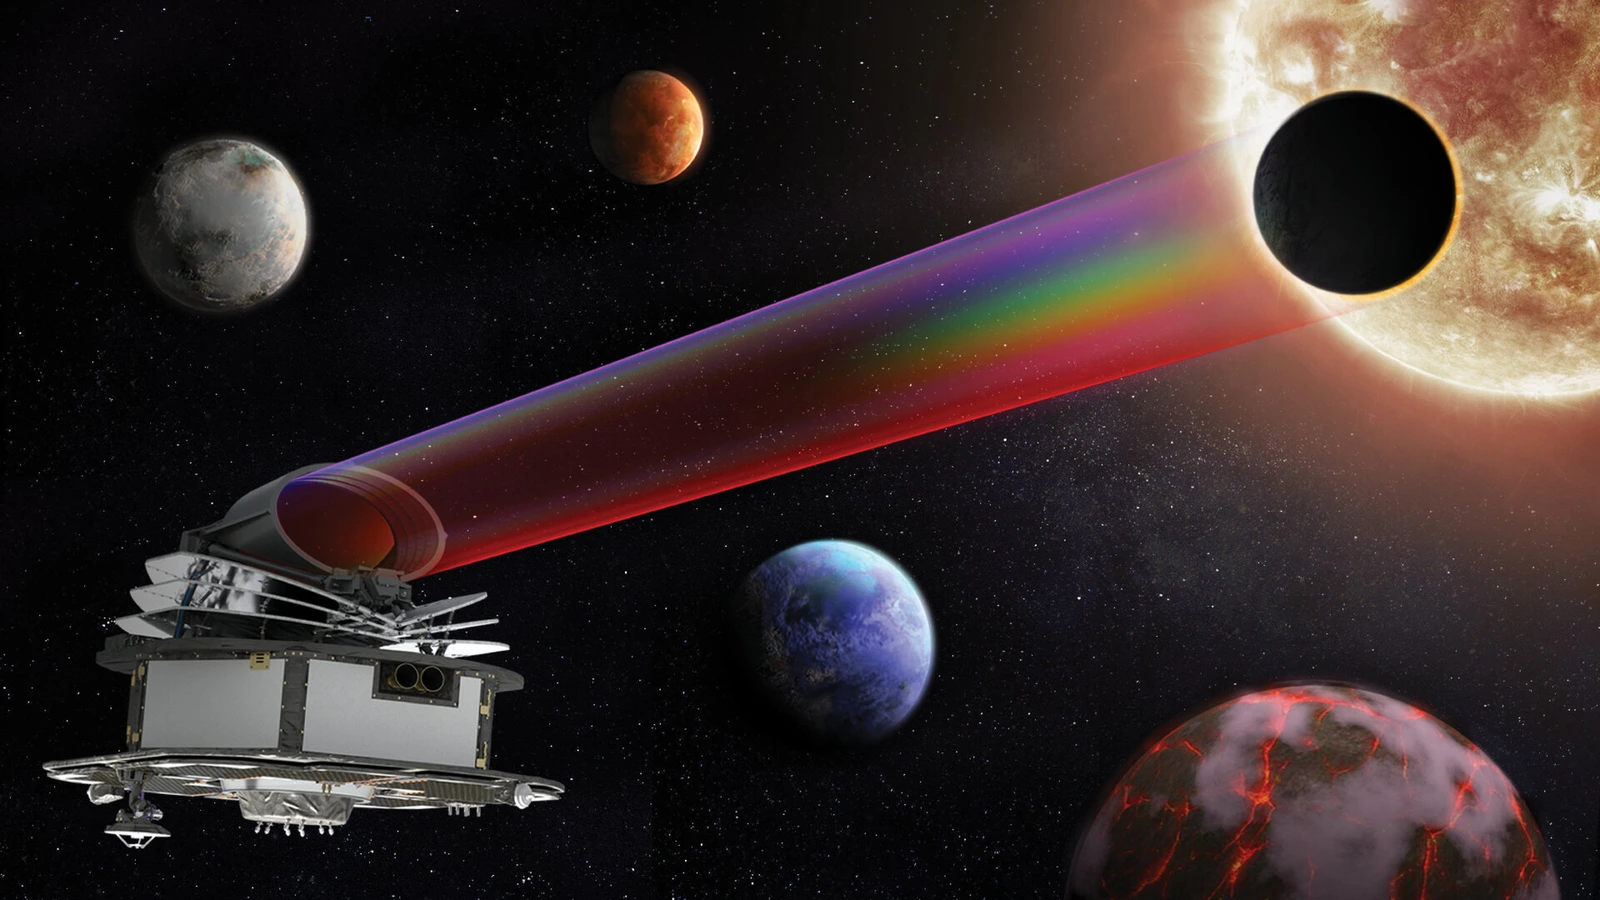
ESA’s planned Ariel mission will compare infrared light in transits and eclipses. Learn how this could reveal atmospheric patterns—without treating a future survey as a result.
World Explained · Space and astronomy
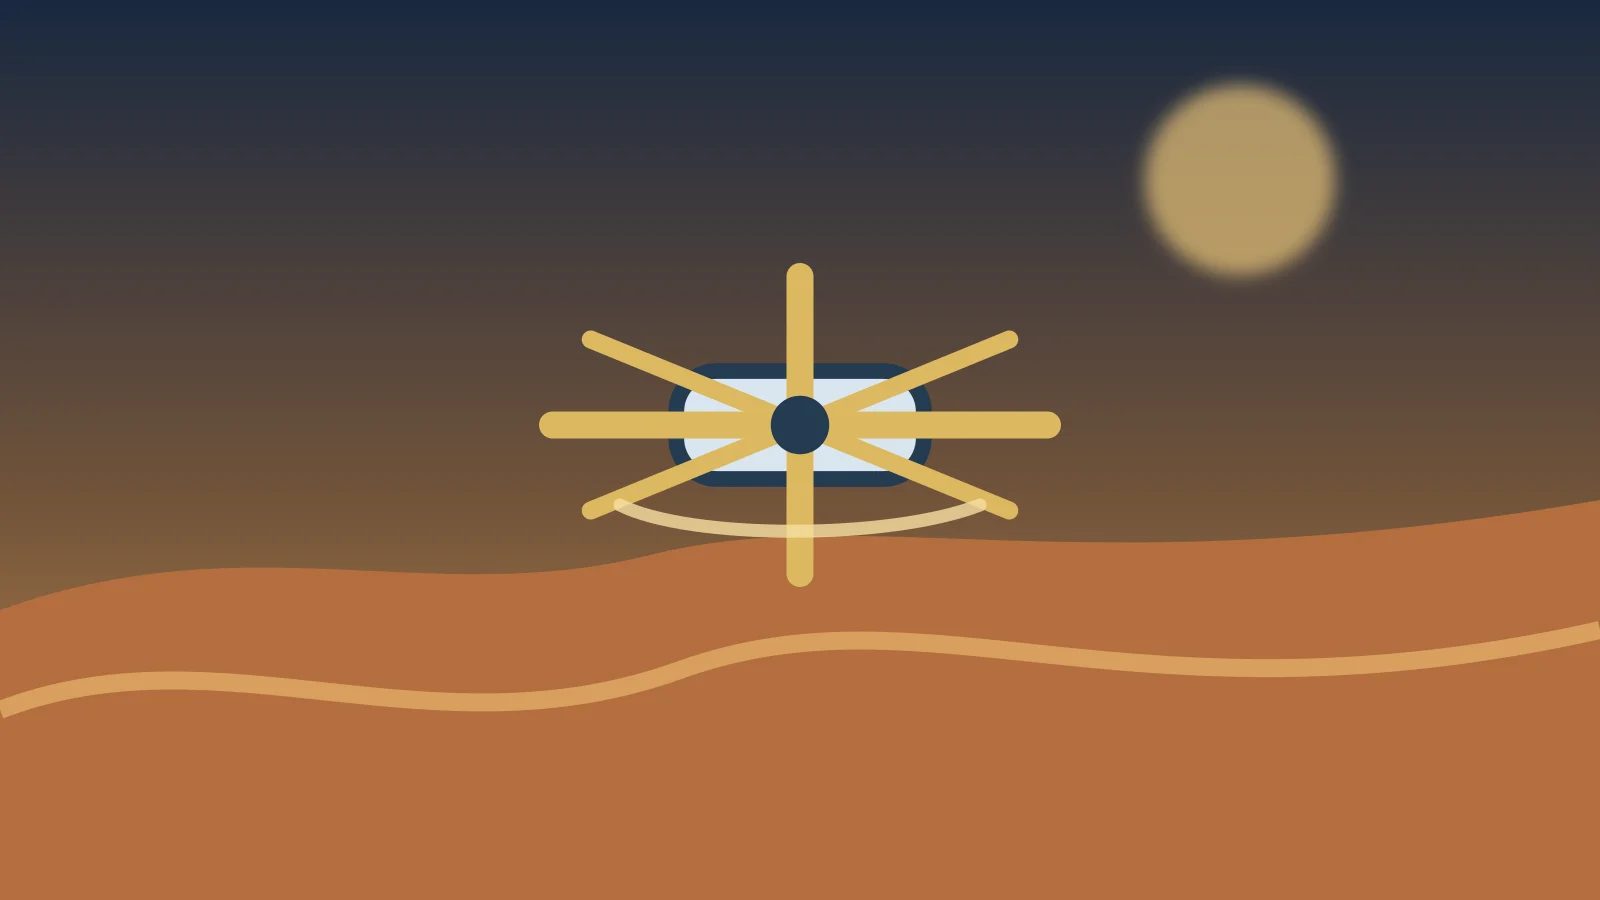
NASA plans to send Dragonfly, a rotorcraft, across Titan after a 2028 launch. Here is why flying could connect separated landscapes—and what the mission cannot show yet.
World Explained · Space and astronomy
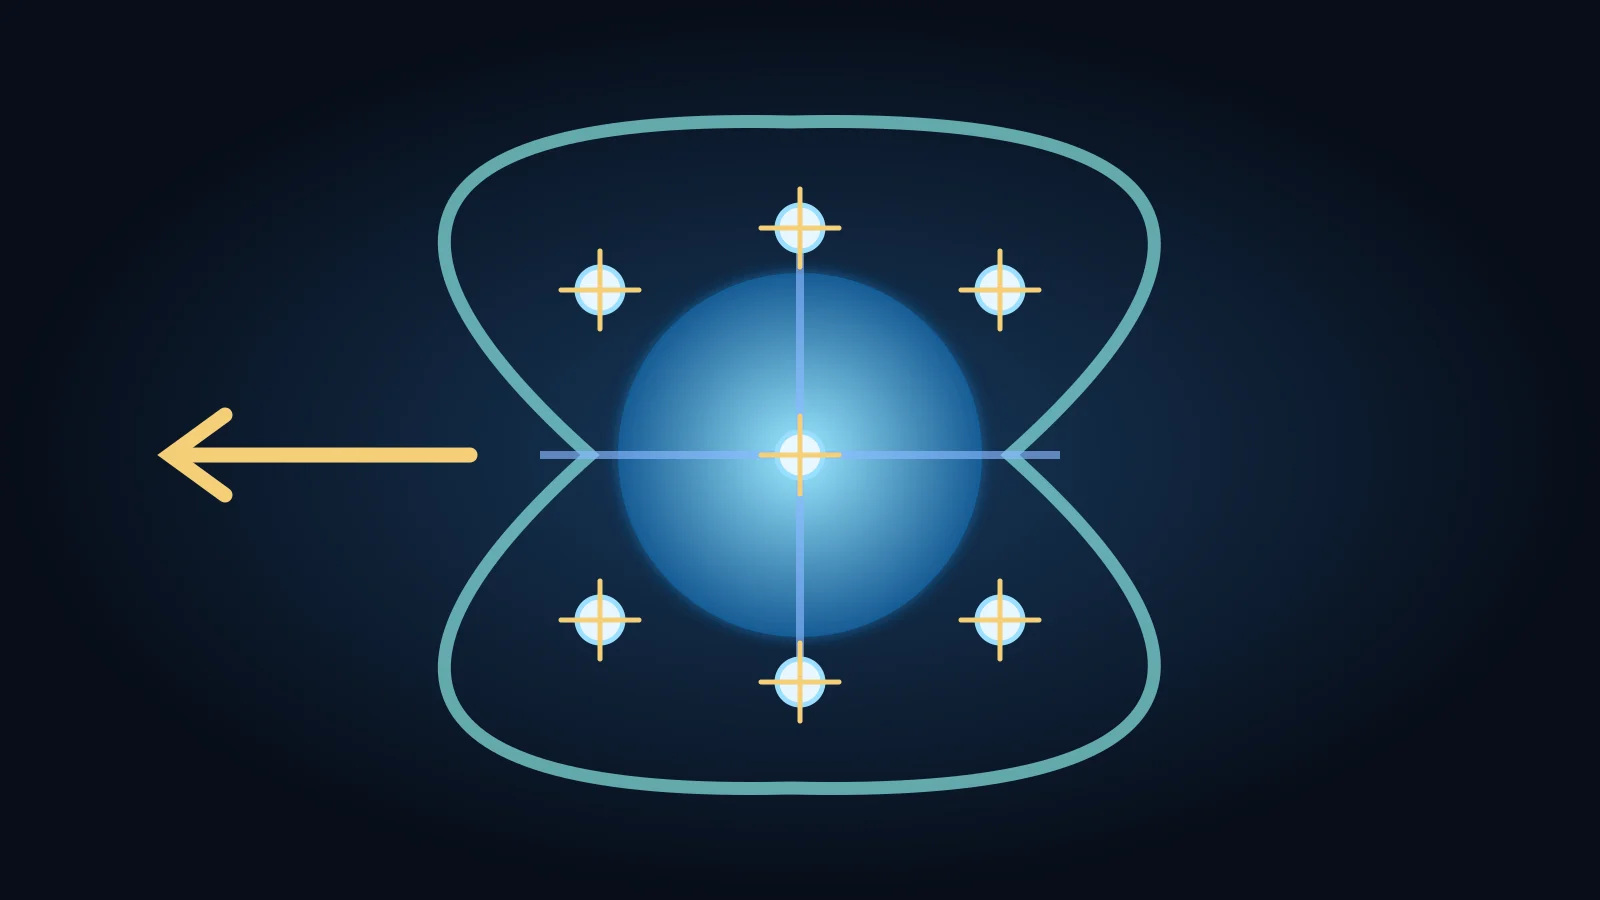
ESA has proposed a seven-spacecraft Plasma Observatory to compare magnetic activity around Earth at several scales. The mission is still awaiting a formal decision.
World Explained · Earth science
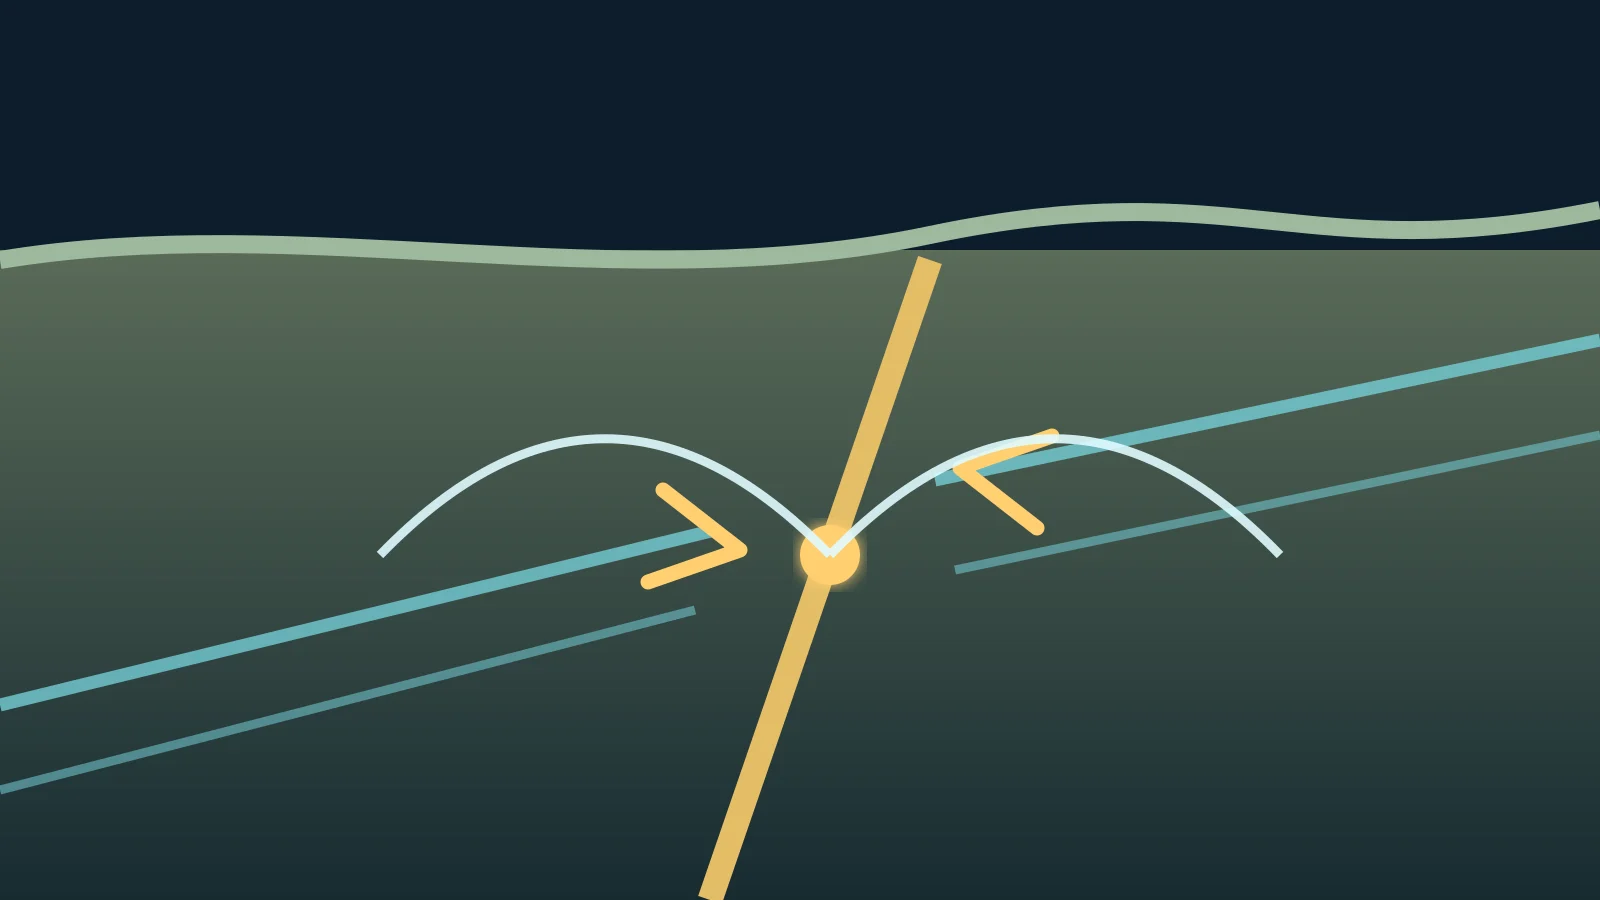
Earthquakes begin when a locked fault suddenly slips. That release sends seismic waves through rock, while the shaking at any one place depends on more than magnitude.
World Explained · Weather and climate
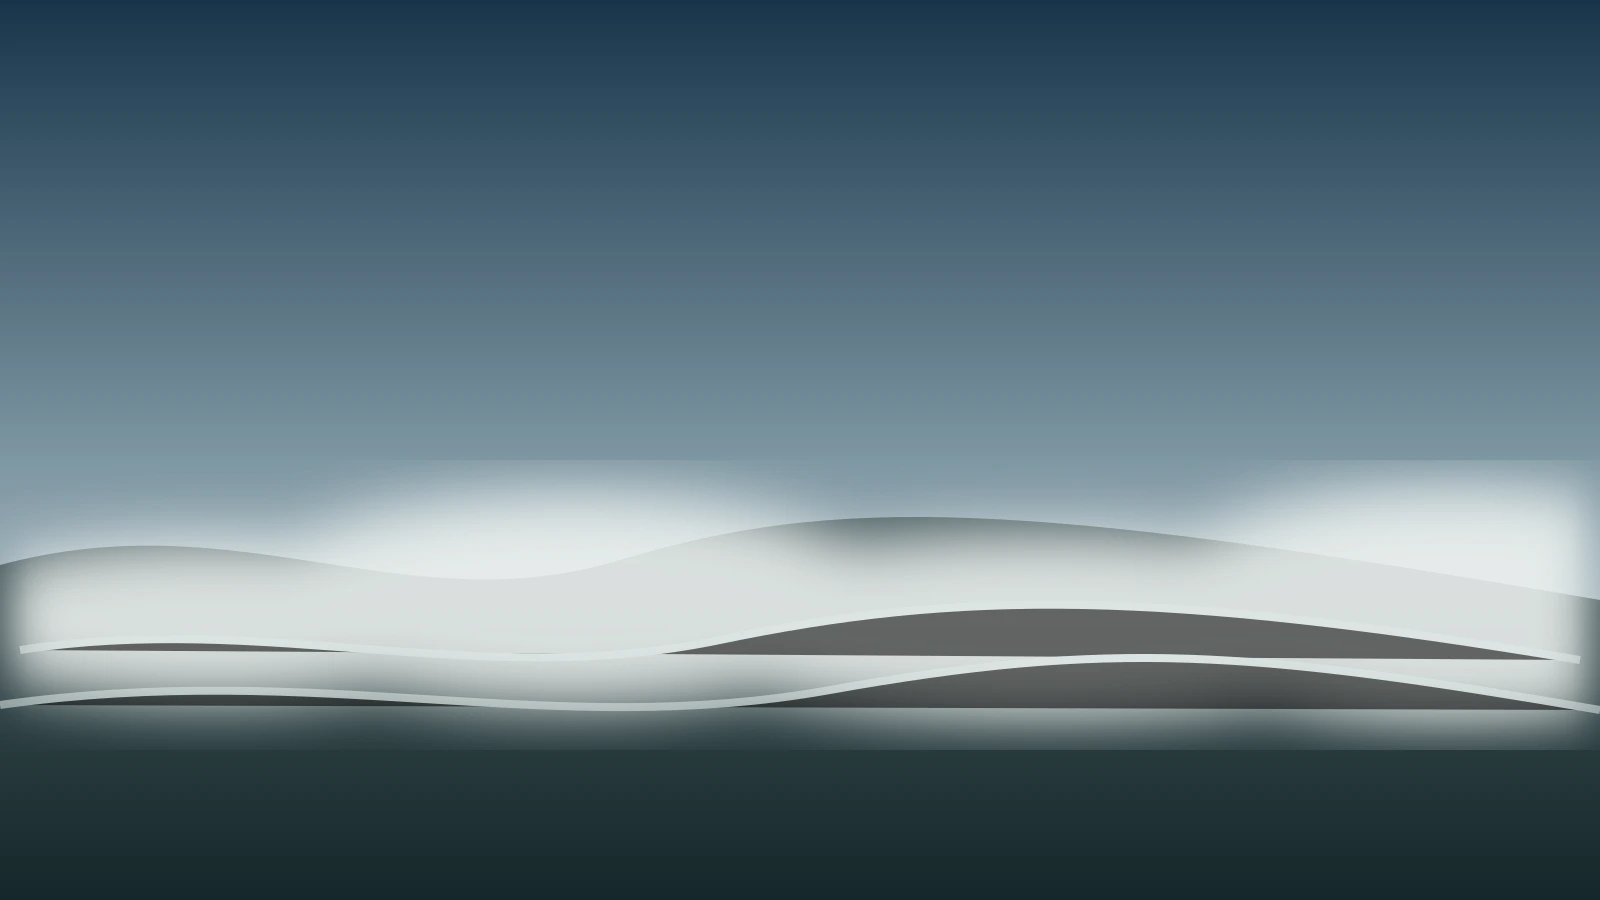
Fog forms when air close to the ground cools to saturation and water vapour condenses into tiny droplets. Radiation and advection fog reach that point by different routes.
World Explained · Space and astronomy
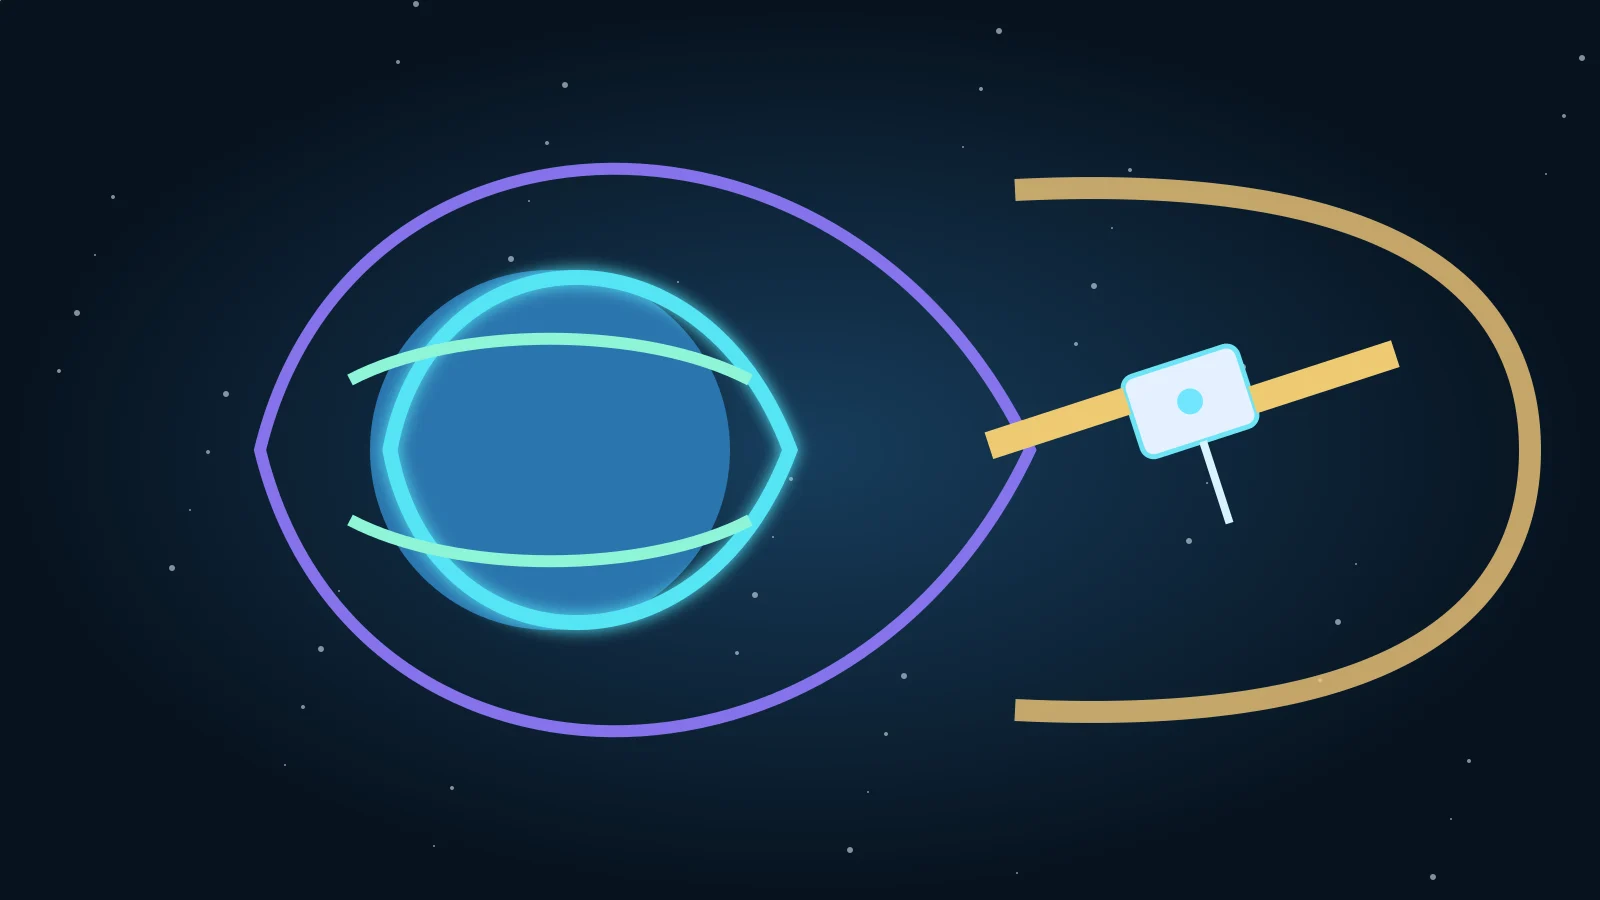
Smile combines X-ray, ultraviolet, particle and magnetic measurements to watch the solar wind meet Earth’s magnetic shield. Its science campaign follows commissioning.
World Explained · Space and astronomy
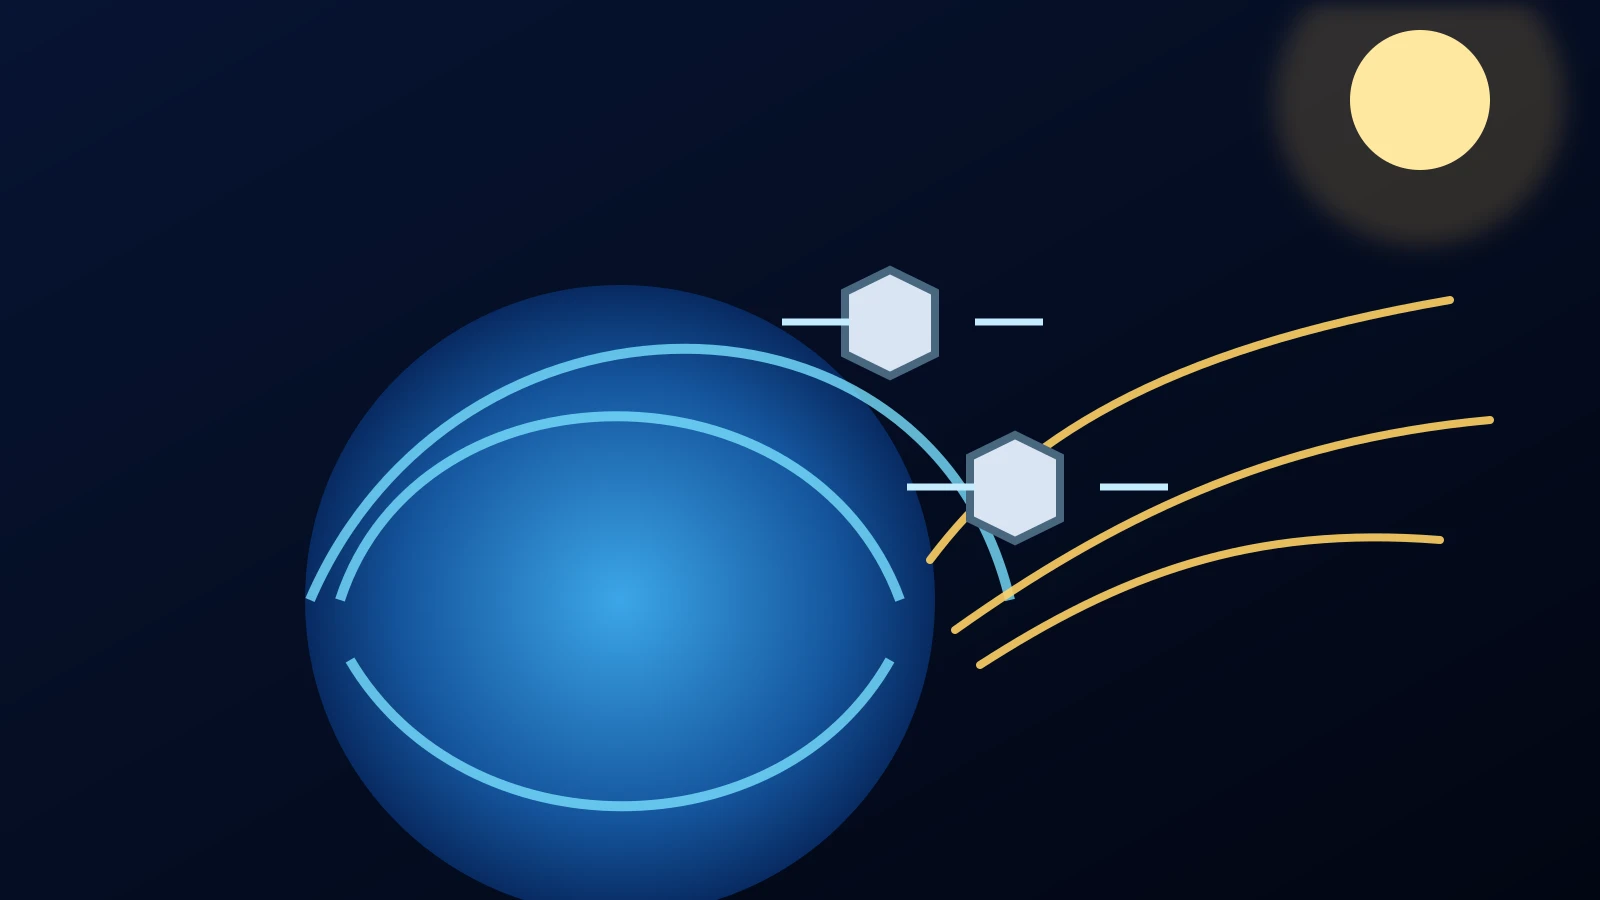
NASA’s TRACERS satellites compare rapid passes through Earth’s polar cusp to test how magnetic reconnection changes. One spacecraft’s limits still shape what the mission can prove.

World Explained · Space and astronomy
Rubin revisits the southern sky through six filters. The repeated measurements turn a position on a map into evidence of changing brightness or motion.
World Explained · Space and astronomy
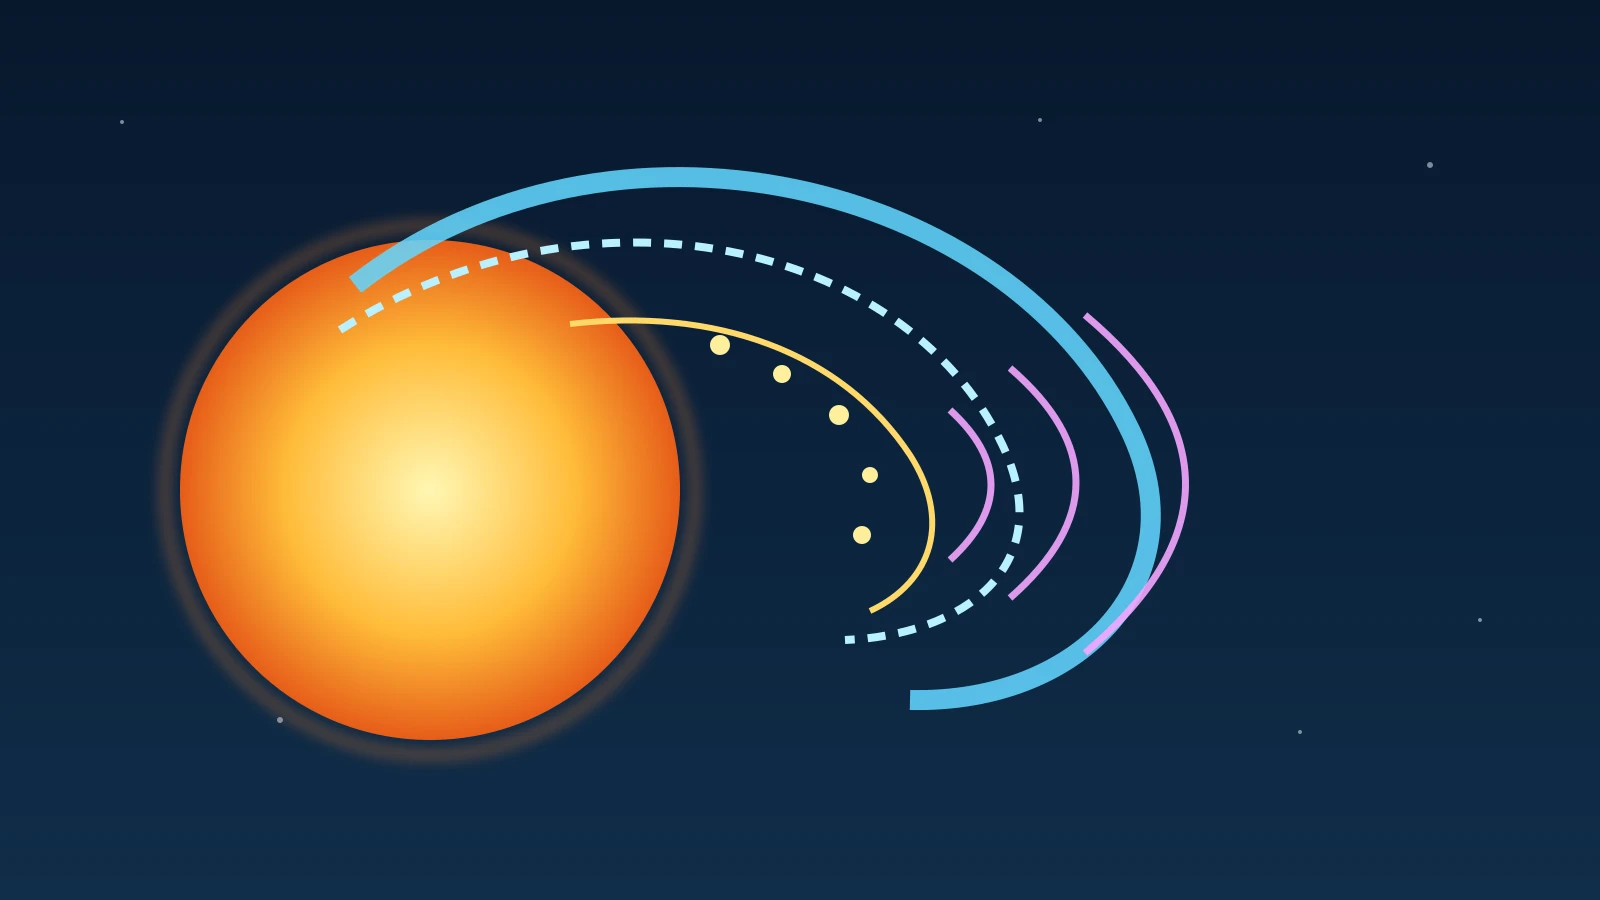
A 19-day Type IV burst came from electrons held in magnetic fields. Spacecraft saw it in stages as rotation changed their view, while its exact longevity remains unsettled.
World Explained · Ocean science
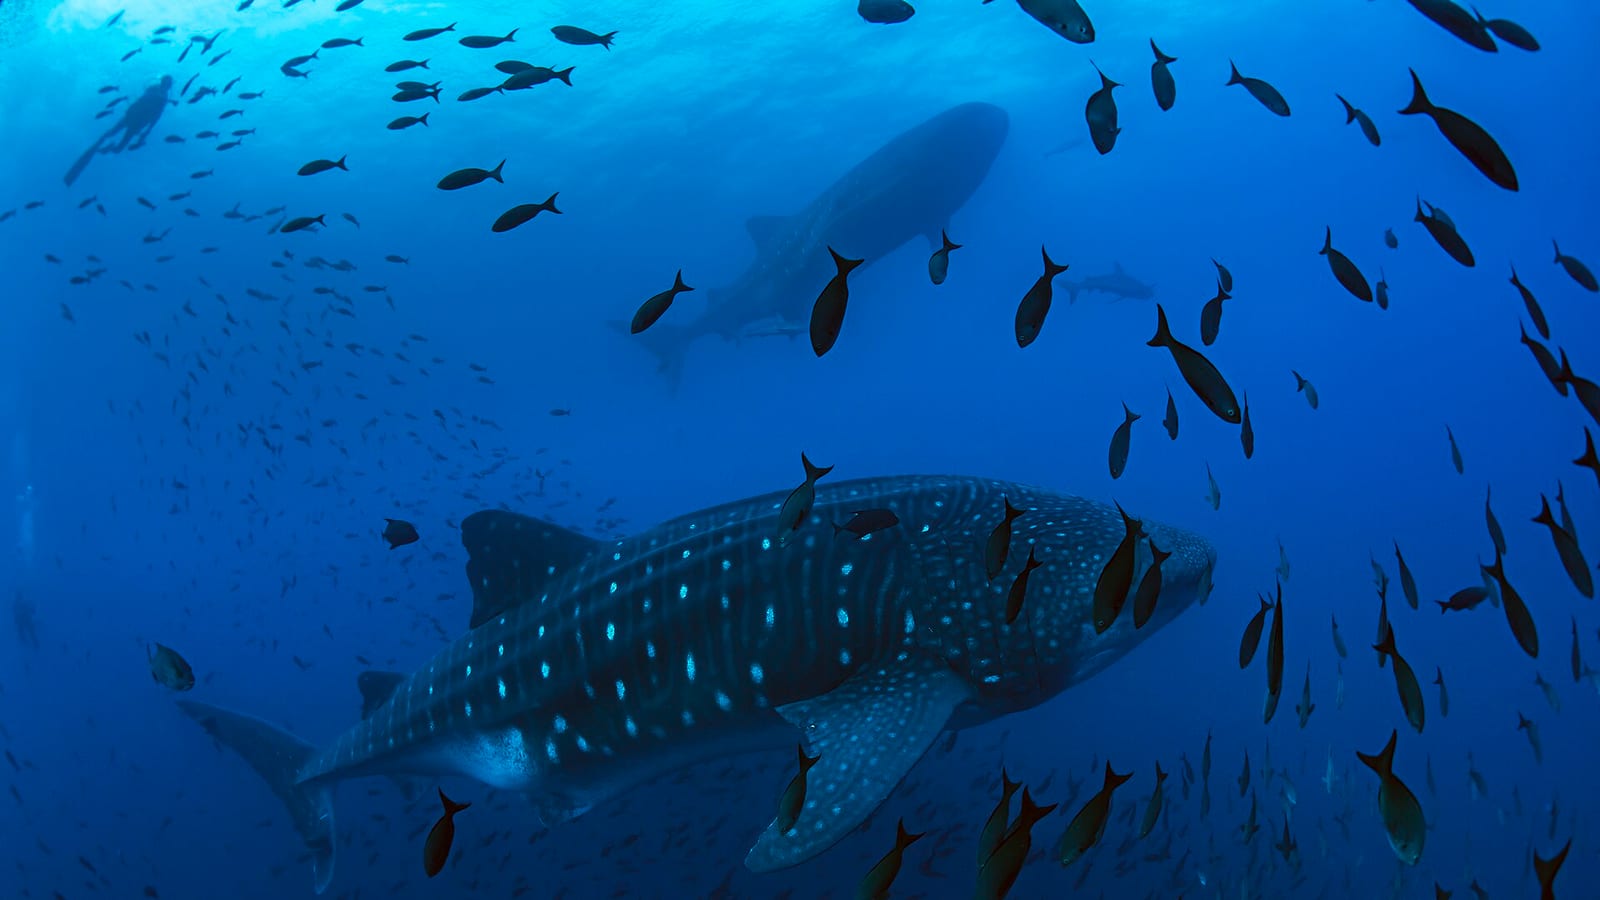
There are more than 500 described shark species. Their different shapes show how one cartilaginous fish blueprint has adapted to feeding and living in very different waters.
World Explained · Space and astronomy
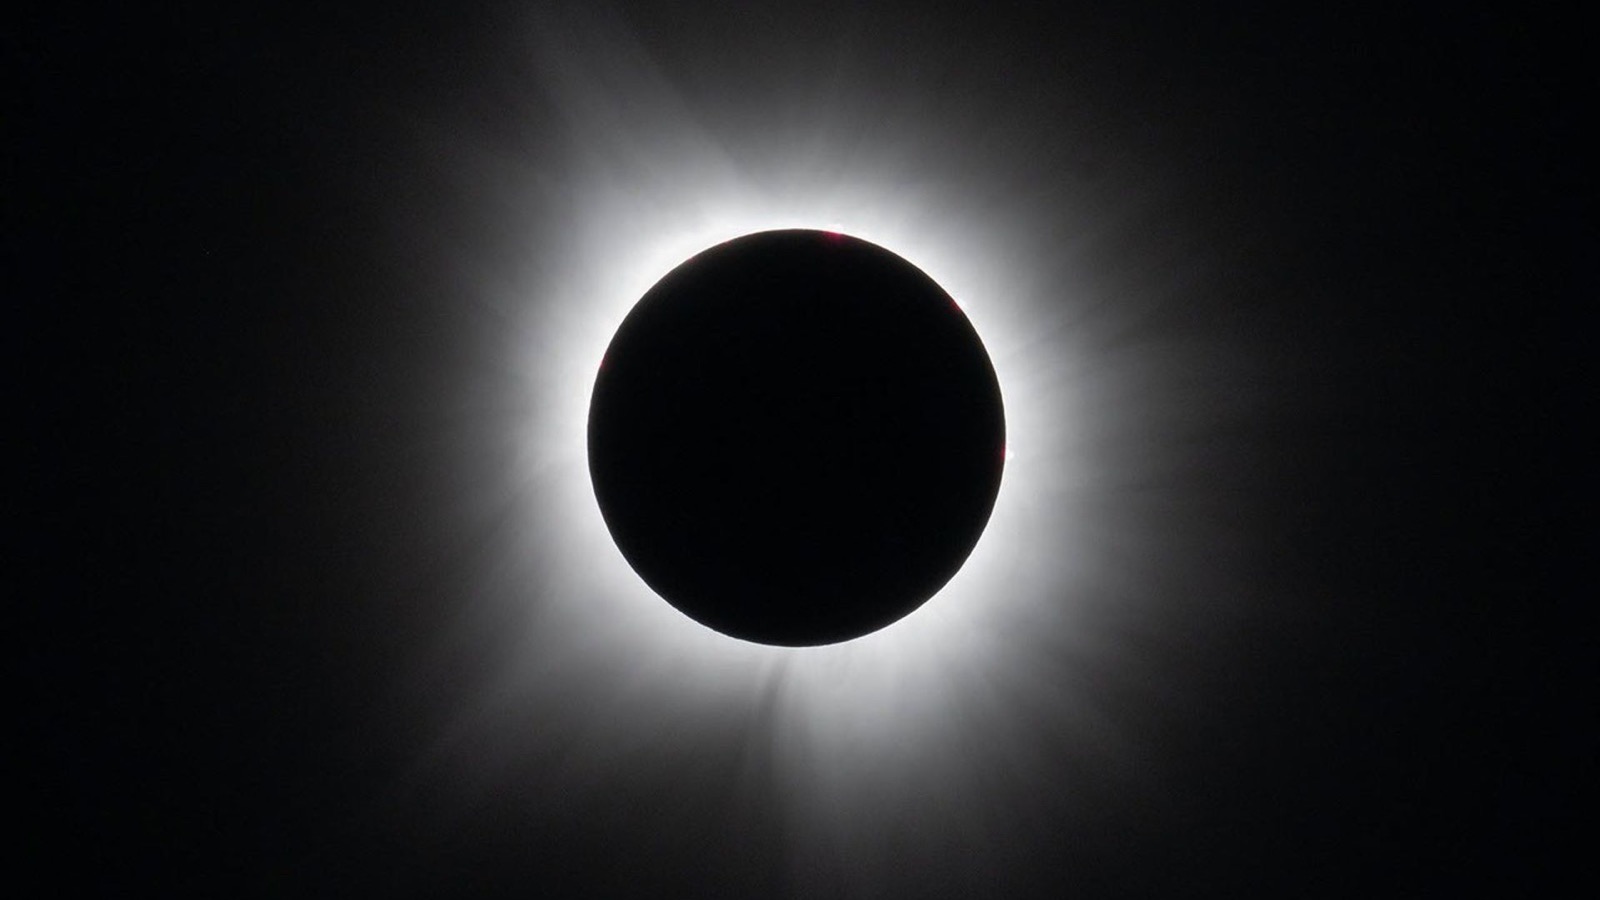
London's maximum eclipse on 12 August 2026 is 91%, but the remaining bright crescent means it is a partial eclipse. The Moon's narrow inner shadow falls elsewhere.
World Explained · Weather and motion
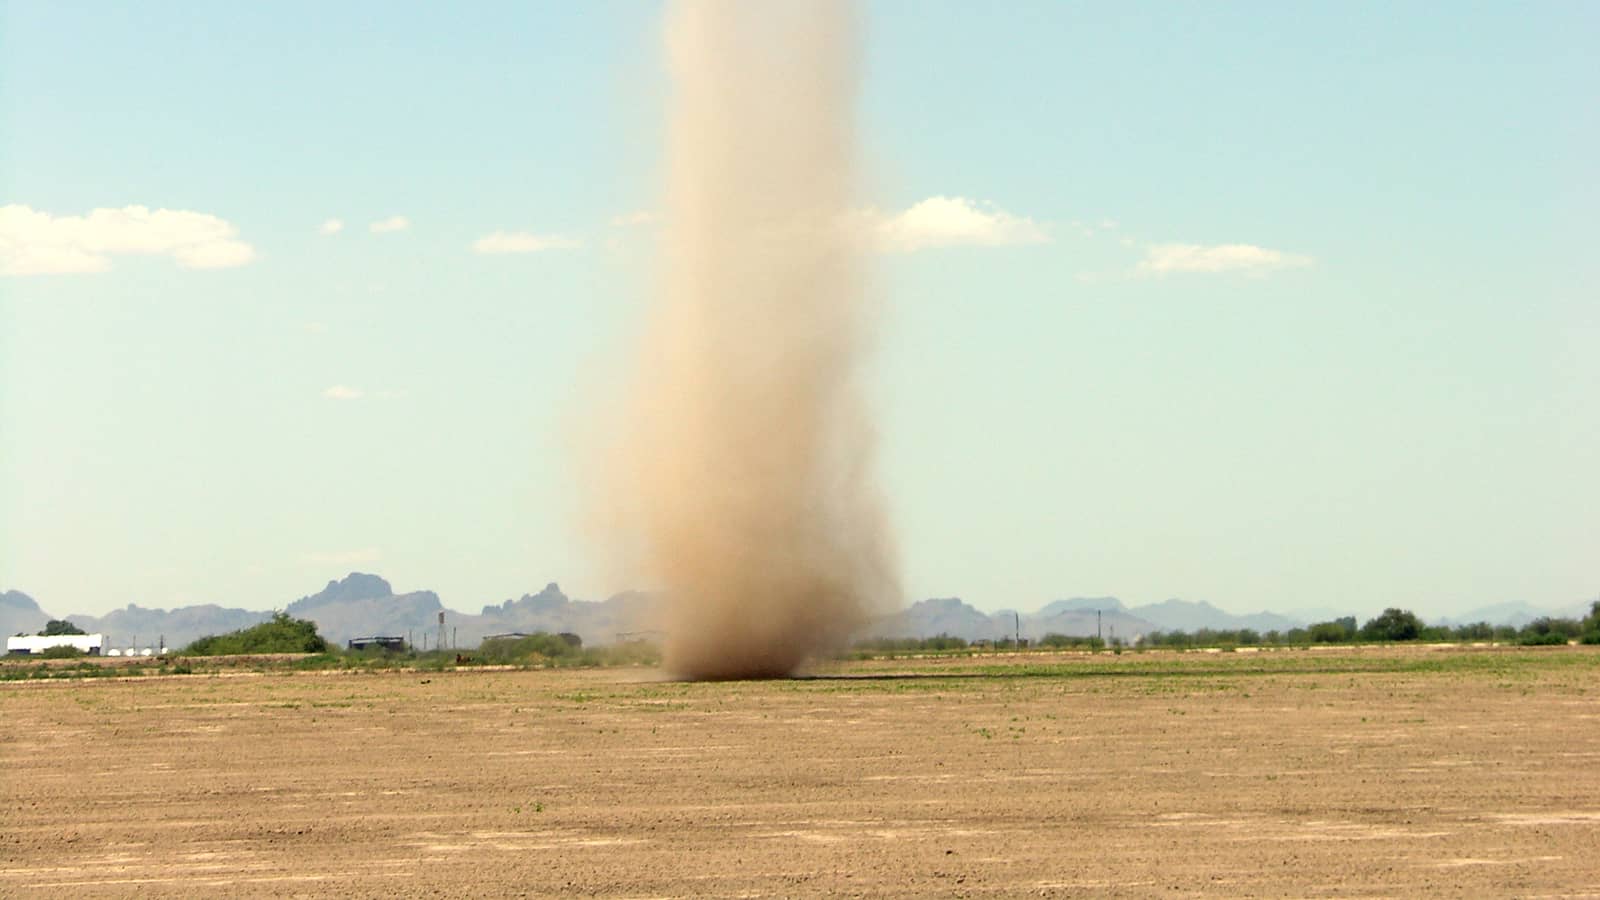
Strong sunshine heats a small patch of ground, buoyant air rises and rotation tightens into a visible column. Unlike a tornado, a dust devil can form beneath clear skies.
World Explained · Space instruments
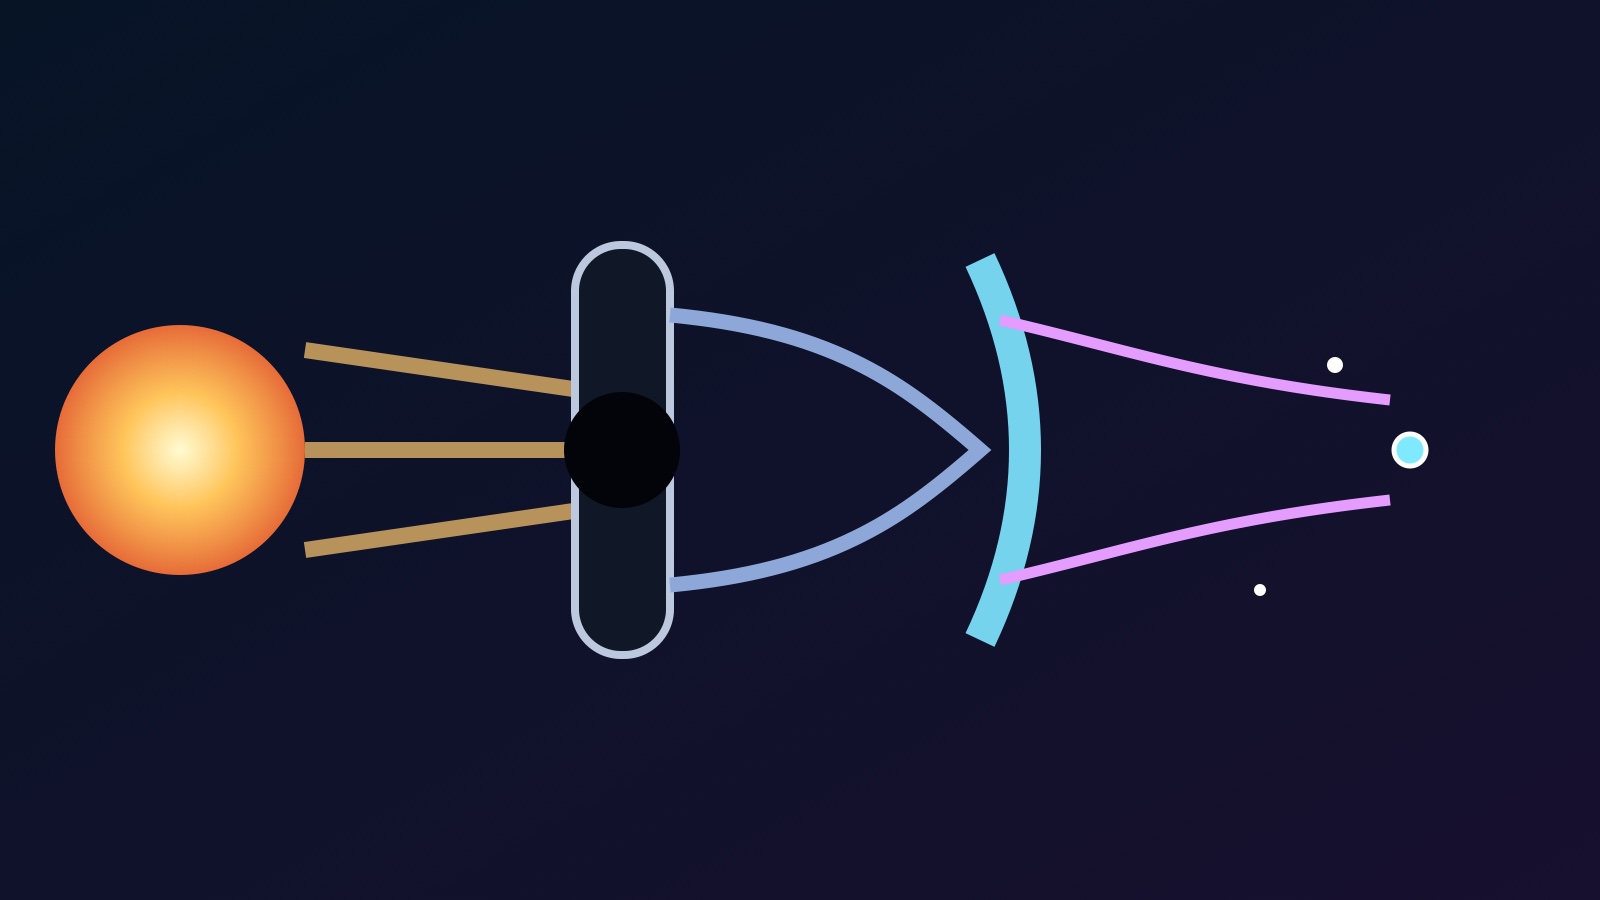
Masks suppress a star's central glare while deformable mirrors cancel leaked speckles, letting NASA test direct-imaging technology for faint giant planets and dusty disks.
World Explained · Space and astronomy
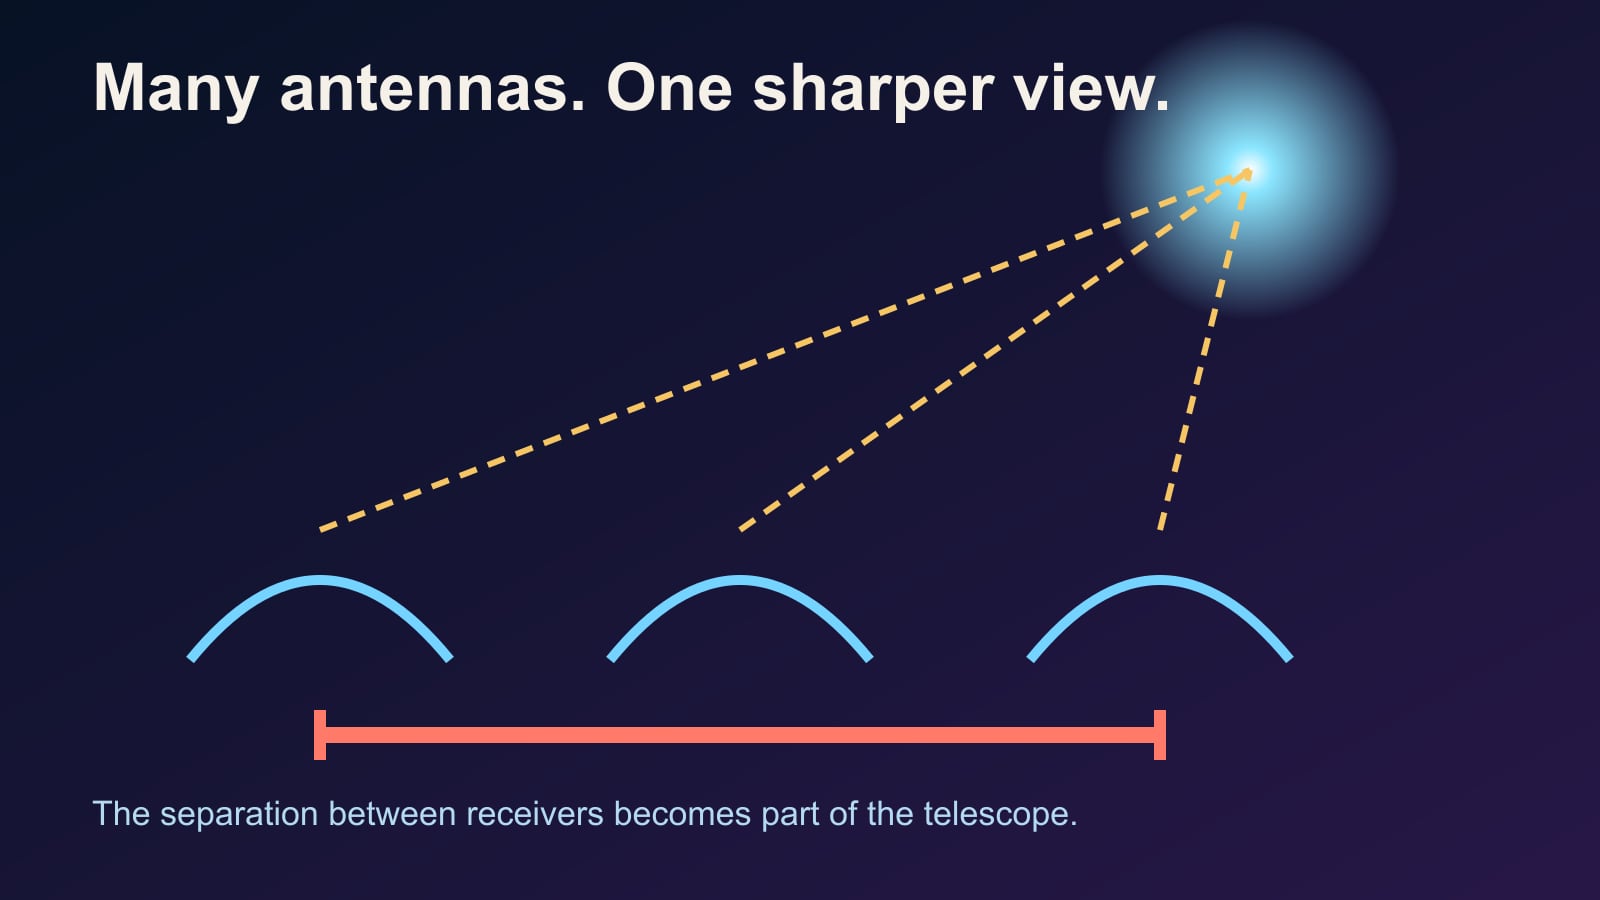
Radio interferometry compares tiny arrival-time and phase differences between antennas. Baselines sharpen detail, while a correlator turns paired signals into an image.
World Explained · Animals and materials
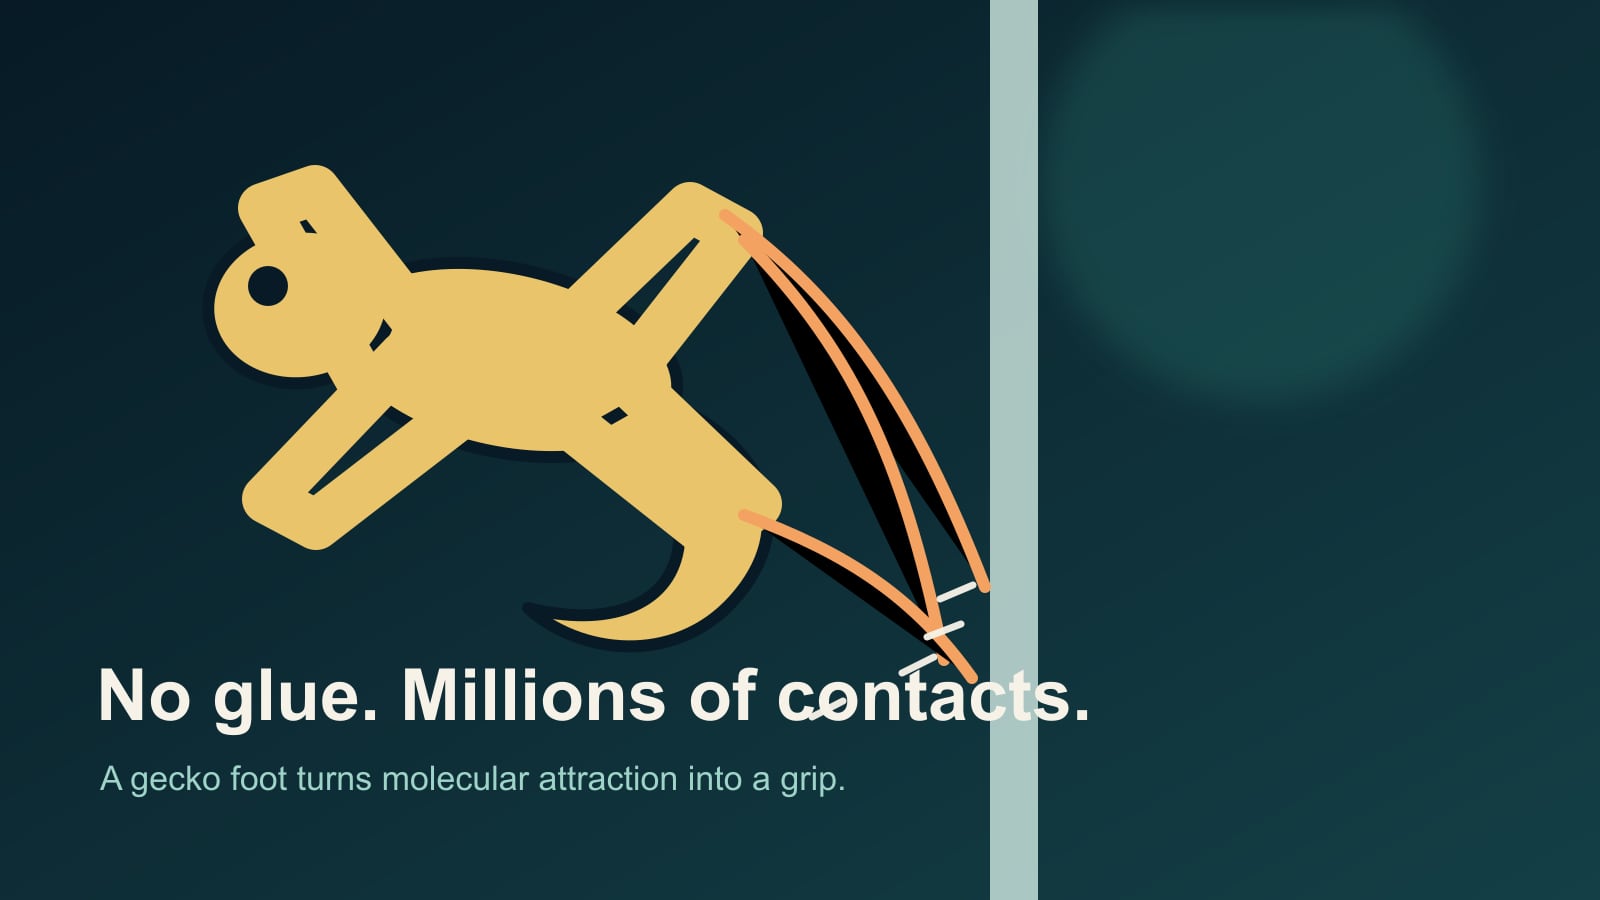
Gecko toes use branching hairs to approach a surface closely enough for van der Waals attraction. Angle, cleanliness and texture decide whether the grip works.
World Explained · Space and astronomy
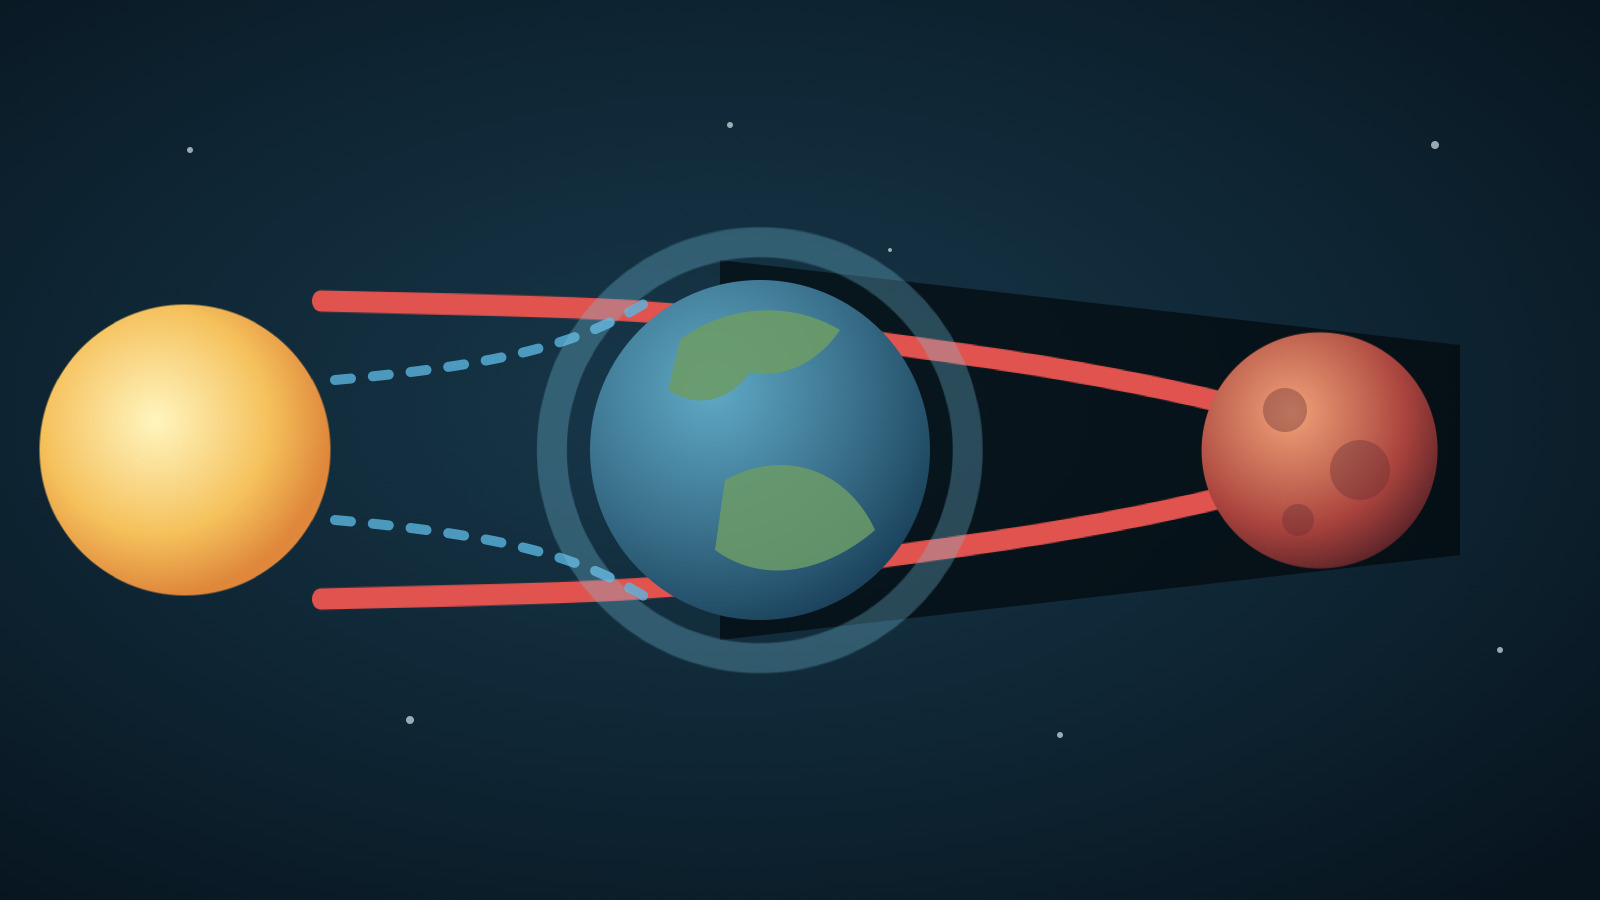
Earth blocks direct sunlight during a lunar eclipse, but its atmosphere filters and bends red-orange light into the shadow, faintly illuminating the Moon.
World Explained · Physics and space
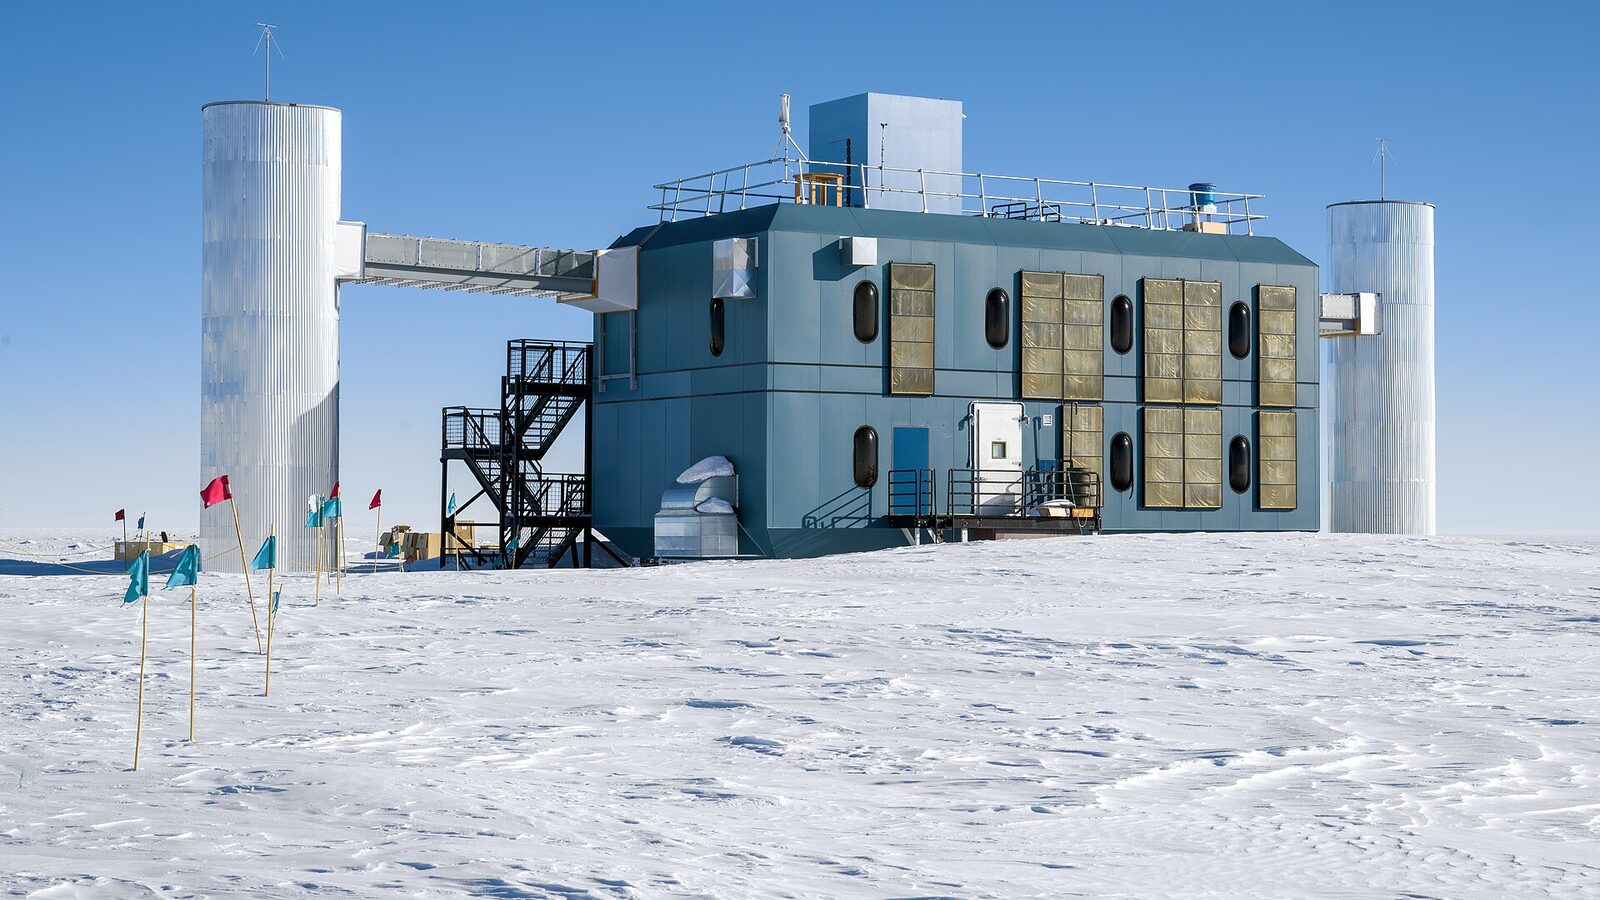
Neutrinos pass through Earth almost unnoticed. When one rarely strikes Antarctic ice, charged debris can outrun light in ice and leave a blue Cherenkov cone.
World Explained · Weather and climate
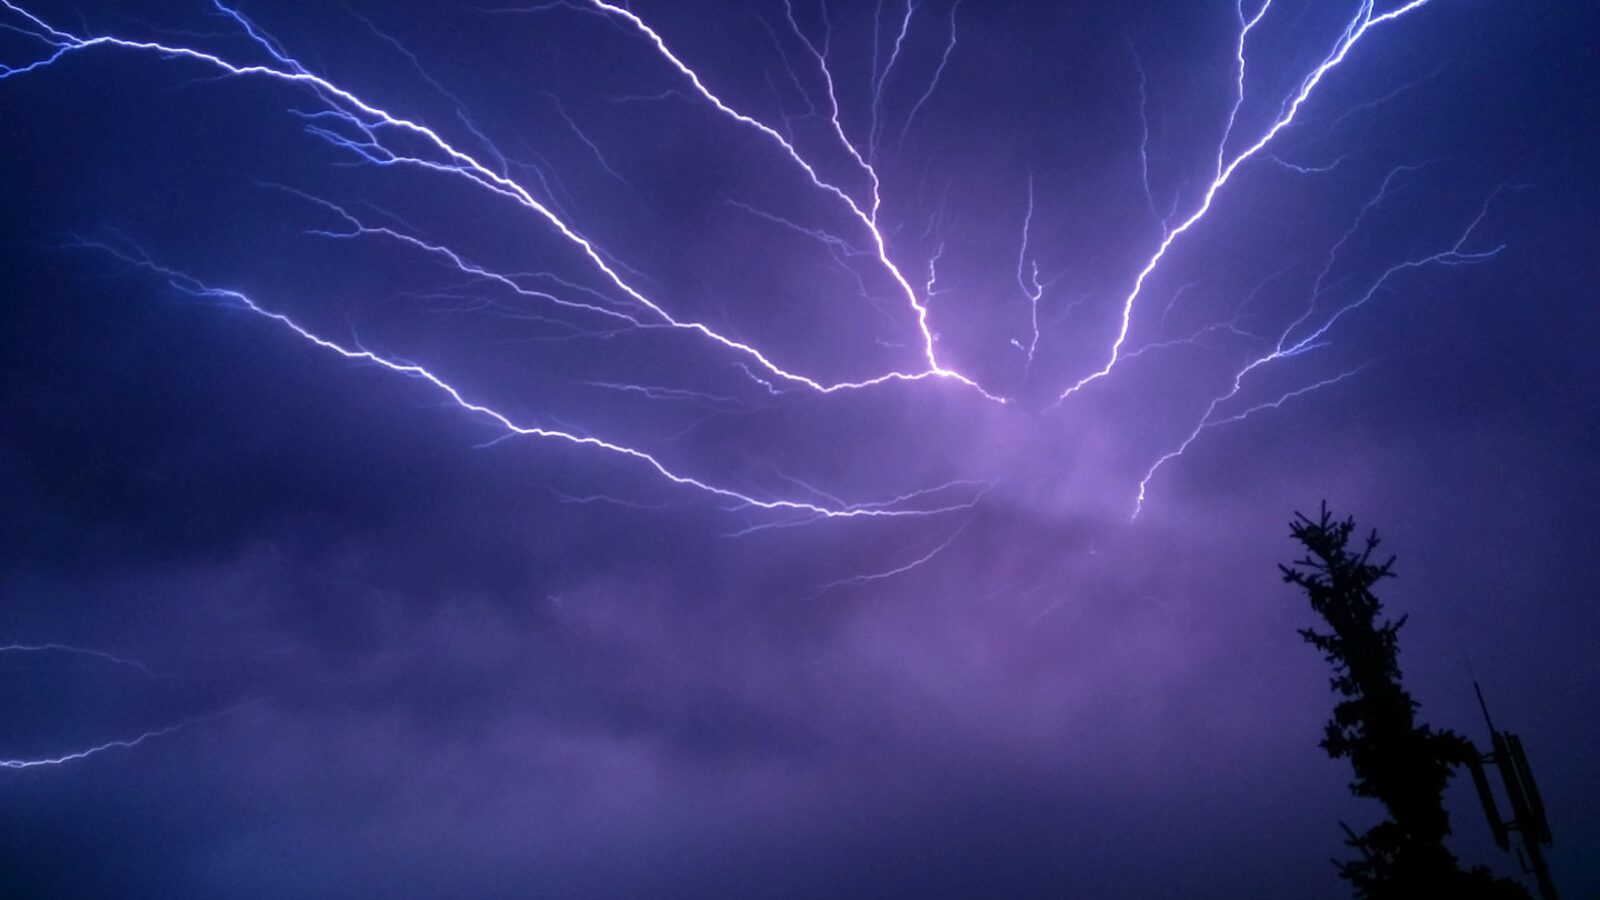
Lightning heats a long, crooked channel of air so quickly that it drives a pressure wave. Distance and channel shape turn that wave into a crack or rumble.
World Explained · Earth and nature
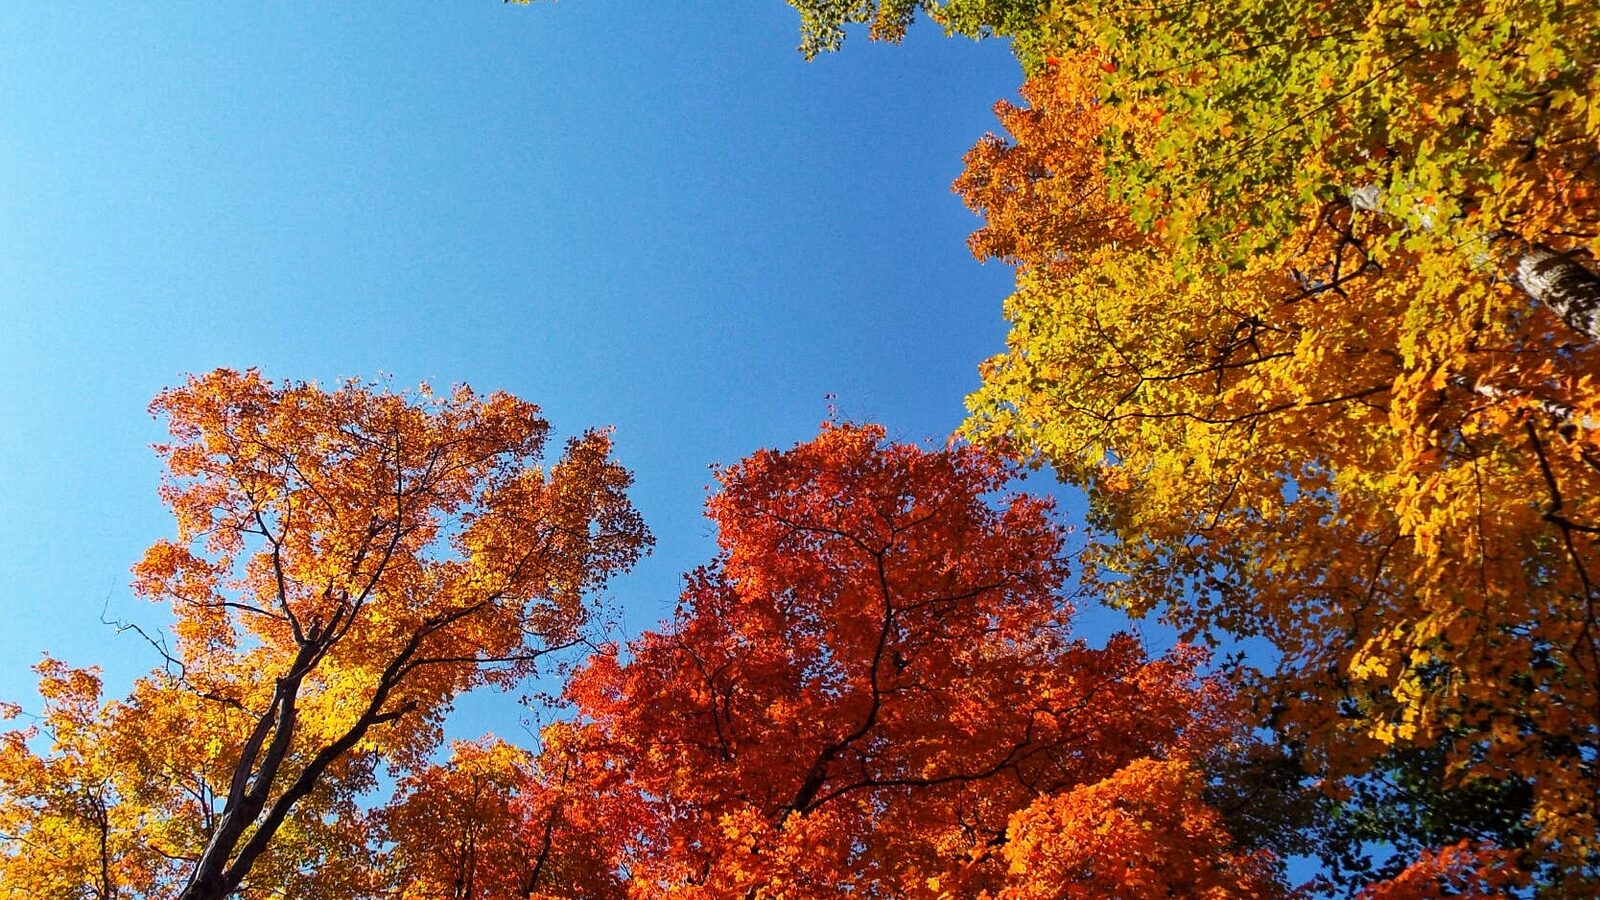
Leaves do not simply fill with autumn colour. As chlorophyll is dismantled, existing yellow pigments appear and some trees manufacture red pigments anew.
World Explained · Physics and space
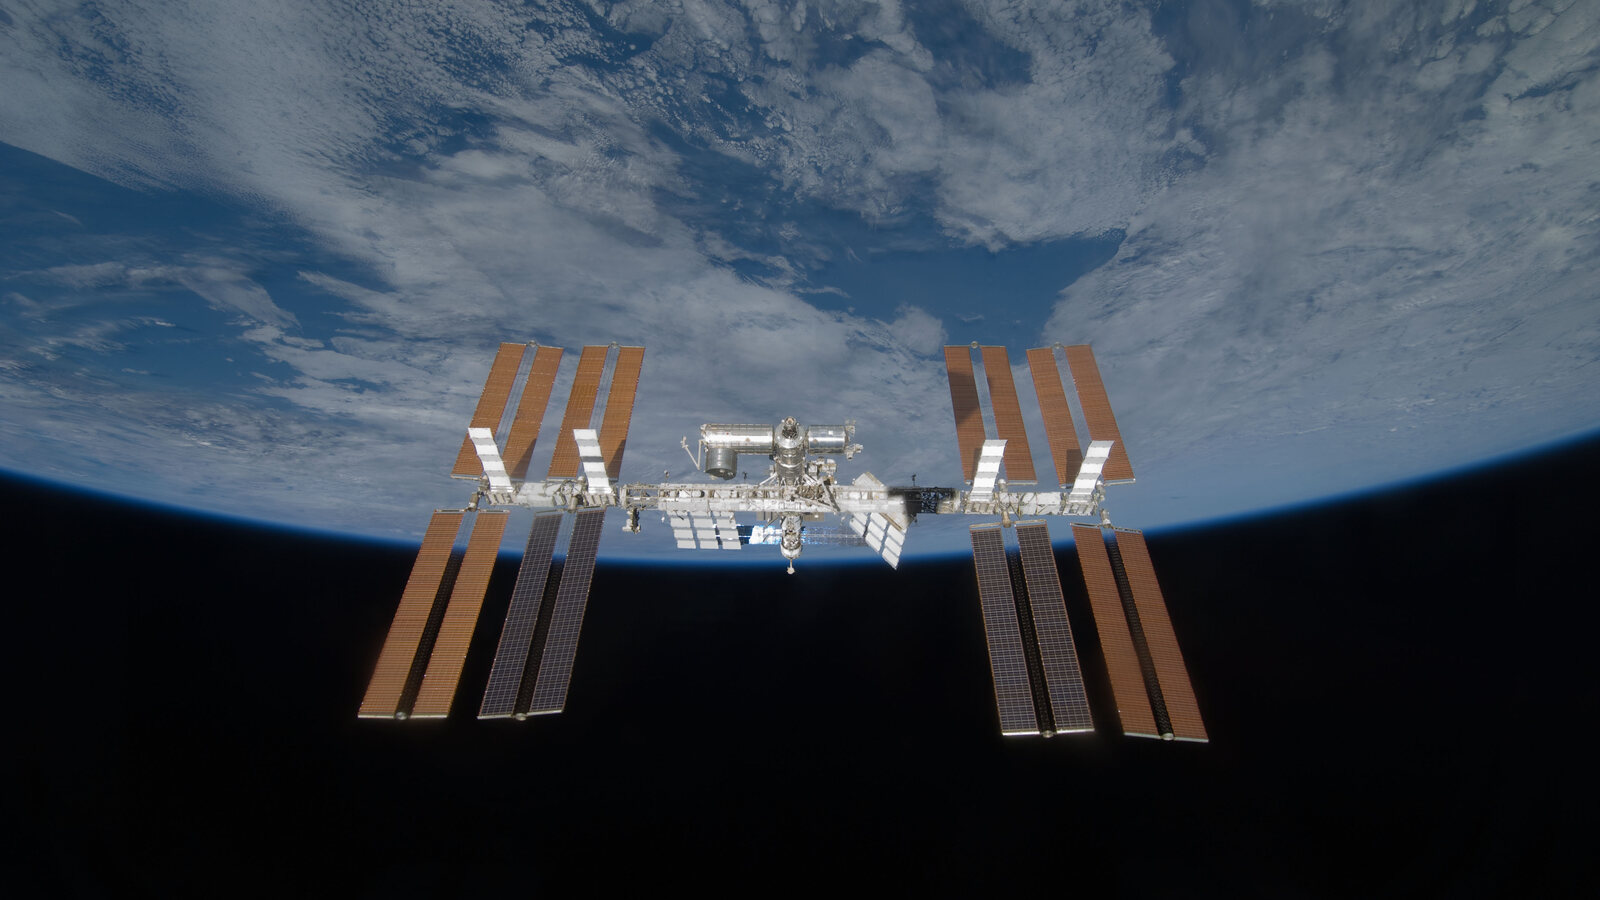
The ISS is not beyond gravity. It falls continuously while moving sideways fast enough to keep missing Earth, and occasional reboosts counter atmospheric drag.
World Explained · Weather and climate
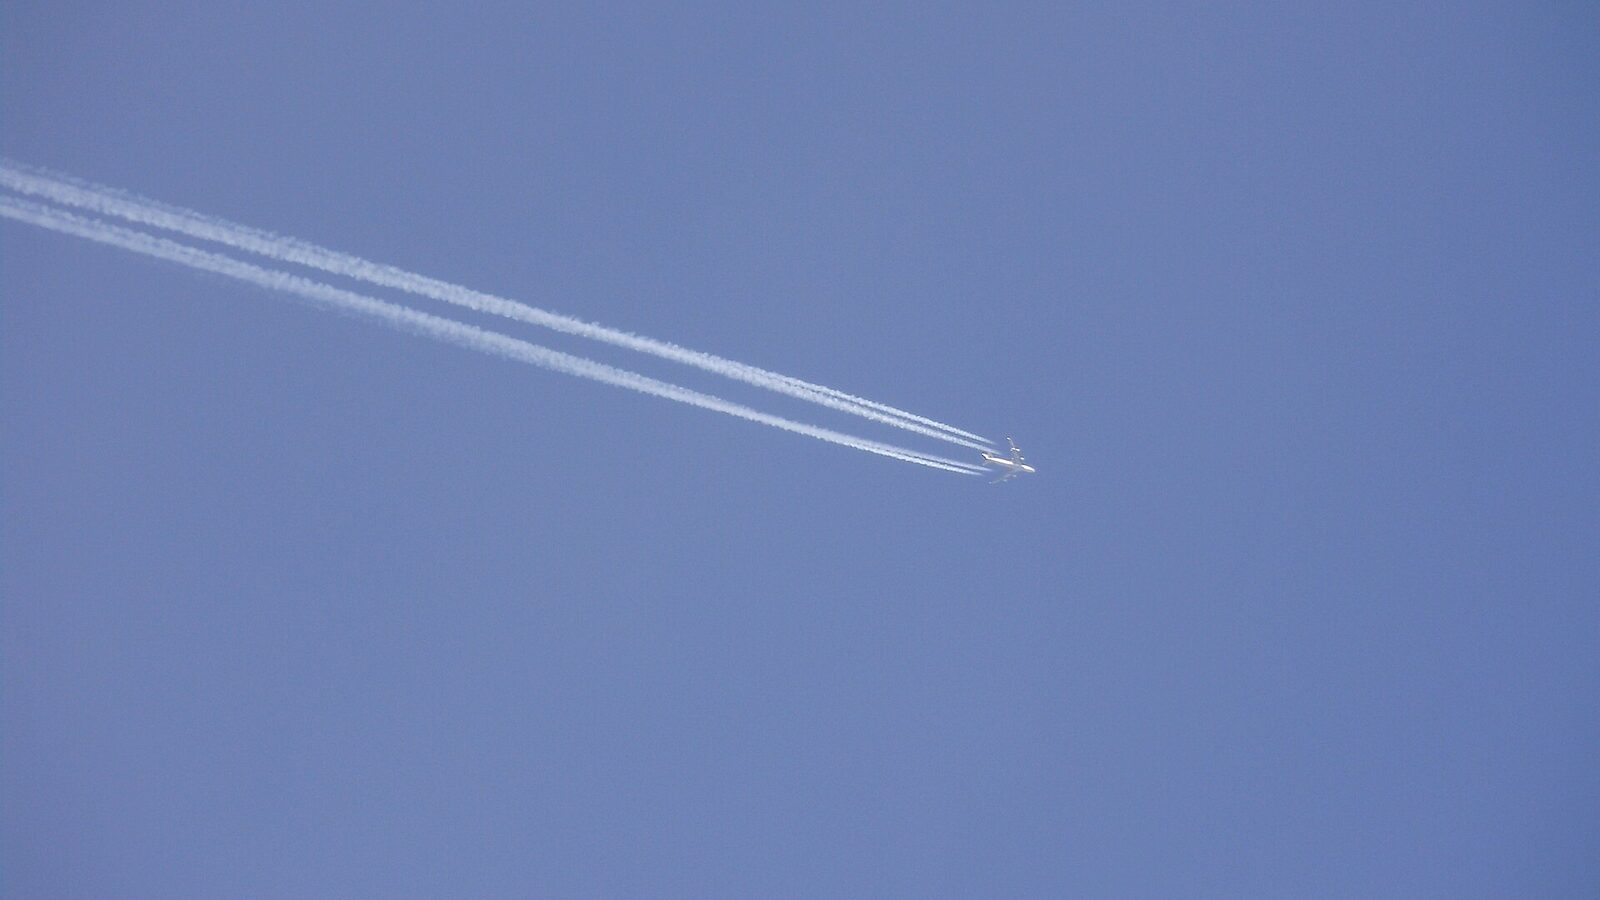
Jet exhaust starts a trail of ice crystals, but the surrounding upper air decides whether it vanishes, breaks into segments or spreads into cirrus cloud.
World Explained · Physics and space
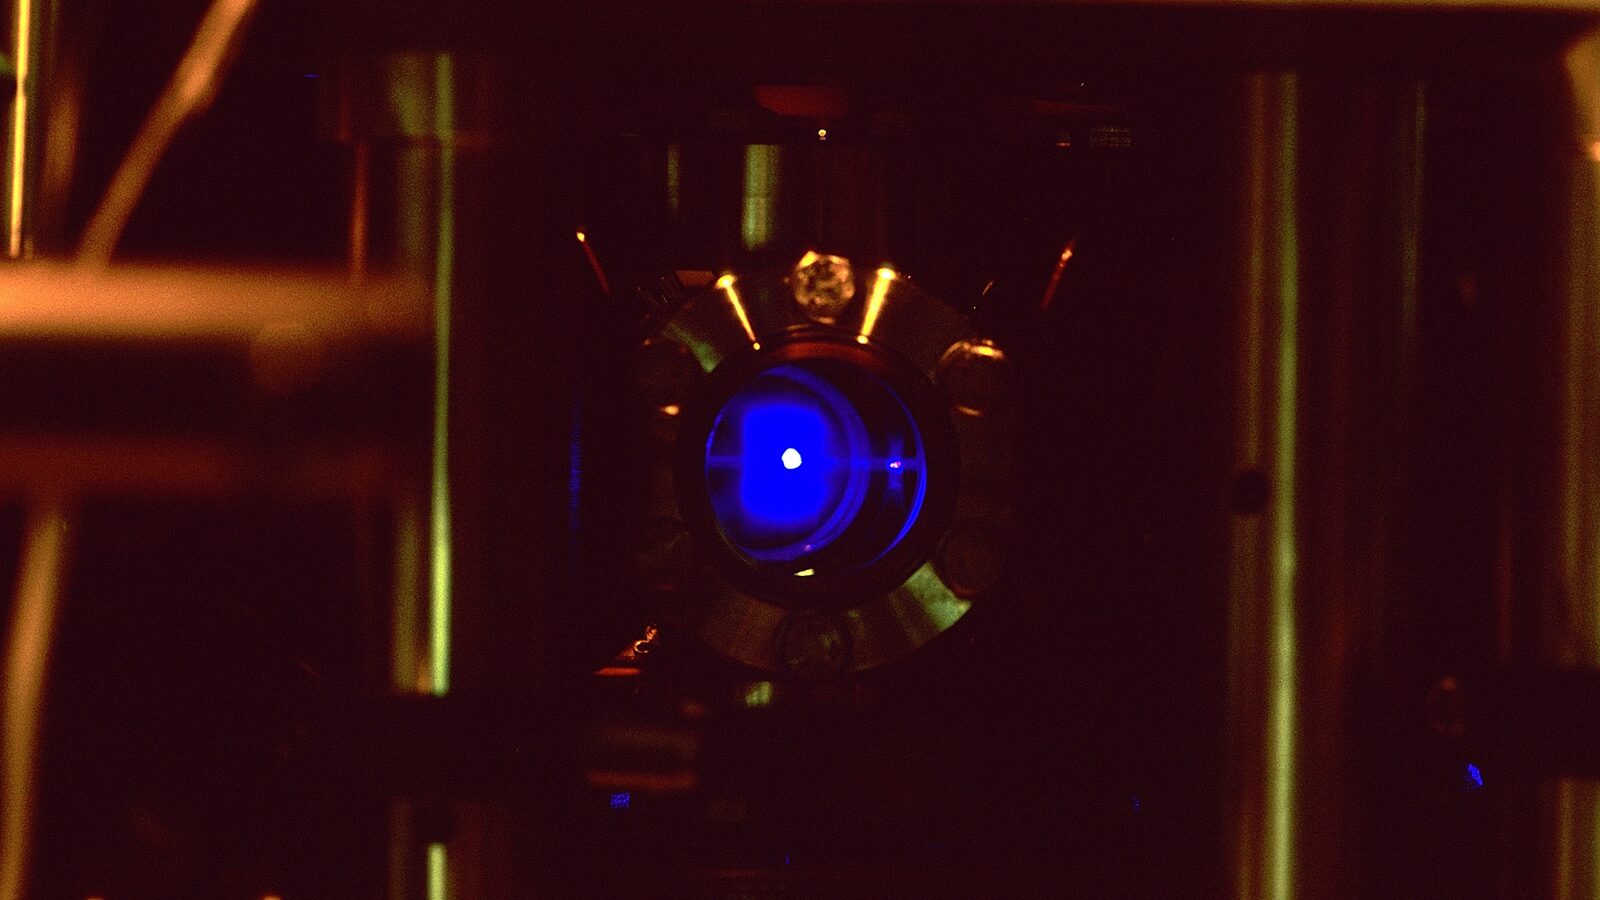
Gravity changes the rate of time. Optical clocks can now resolve that change across a millimetre-high cloud of atoms, turning timekeeping into a height sensor.
World Explained · Physics and space
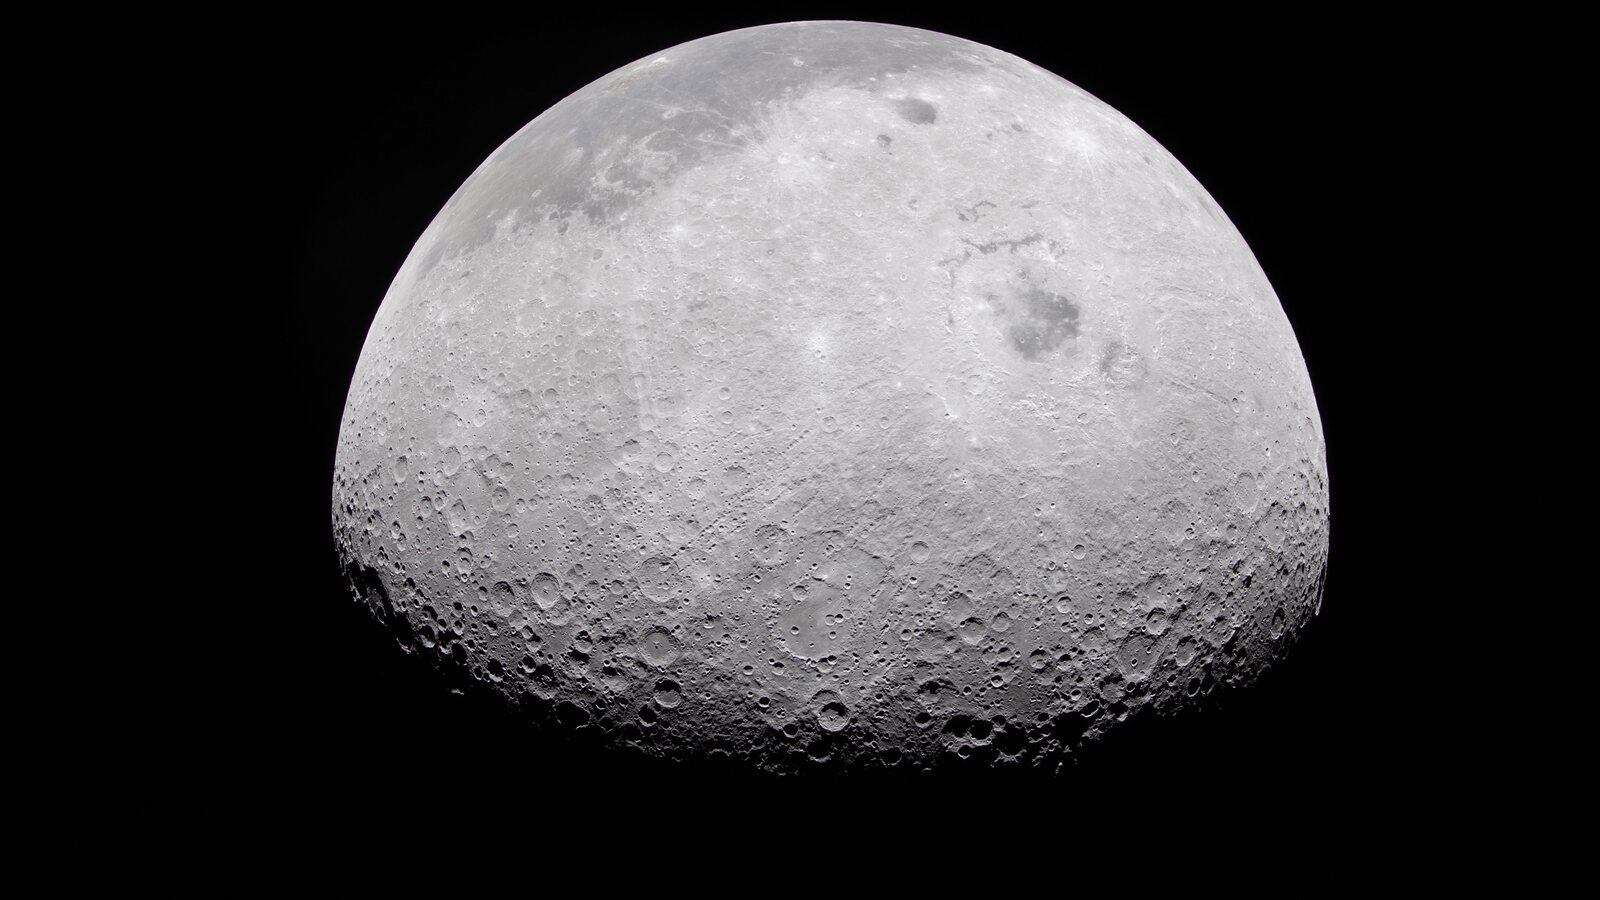
NASA expects a spent Falcon 9 stage to make a roughly 18-metre lunar crater on 5 August. The impact is local, harmless to Earth and scientifically useful.
World Explained · Space
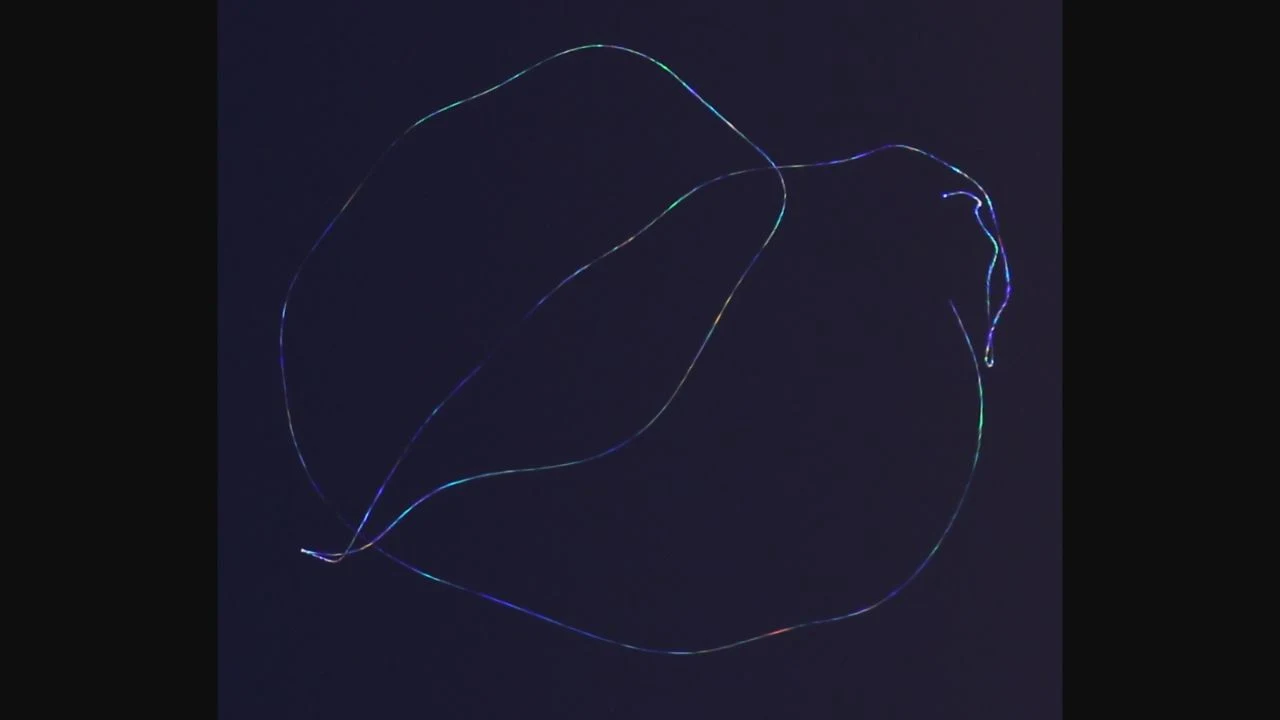
A star is normally steady while moving air makes its point of light jump, brighten and change colour. A planet usually looks calmer because its tiny disk averages much of the disturbance.
World Explained · Space exploration
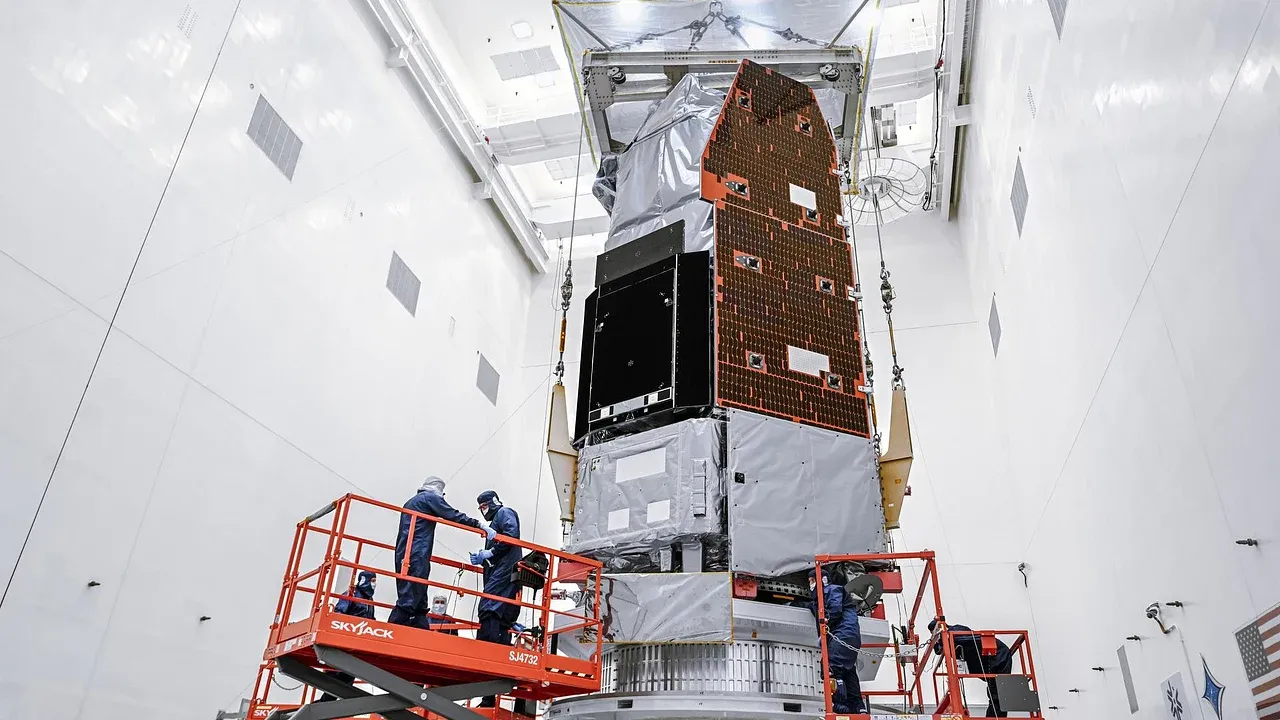
NASA is targeting an August 30 launch for Roman. Its mirror is Hubble-sized, but a 300-megapixel camera will survey at least 100 times more sky.
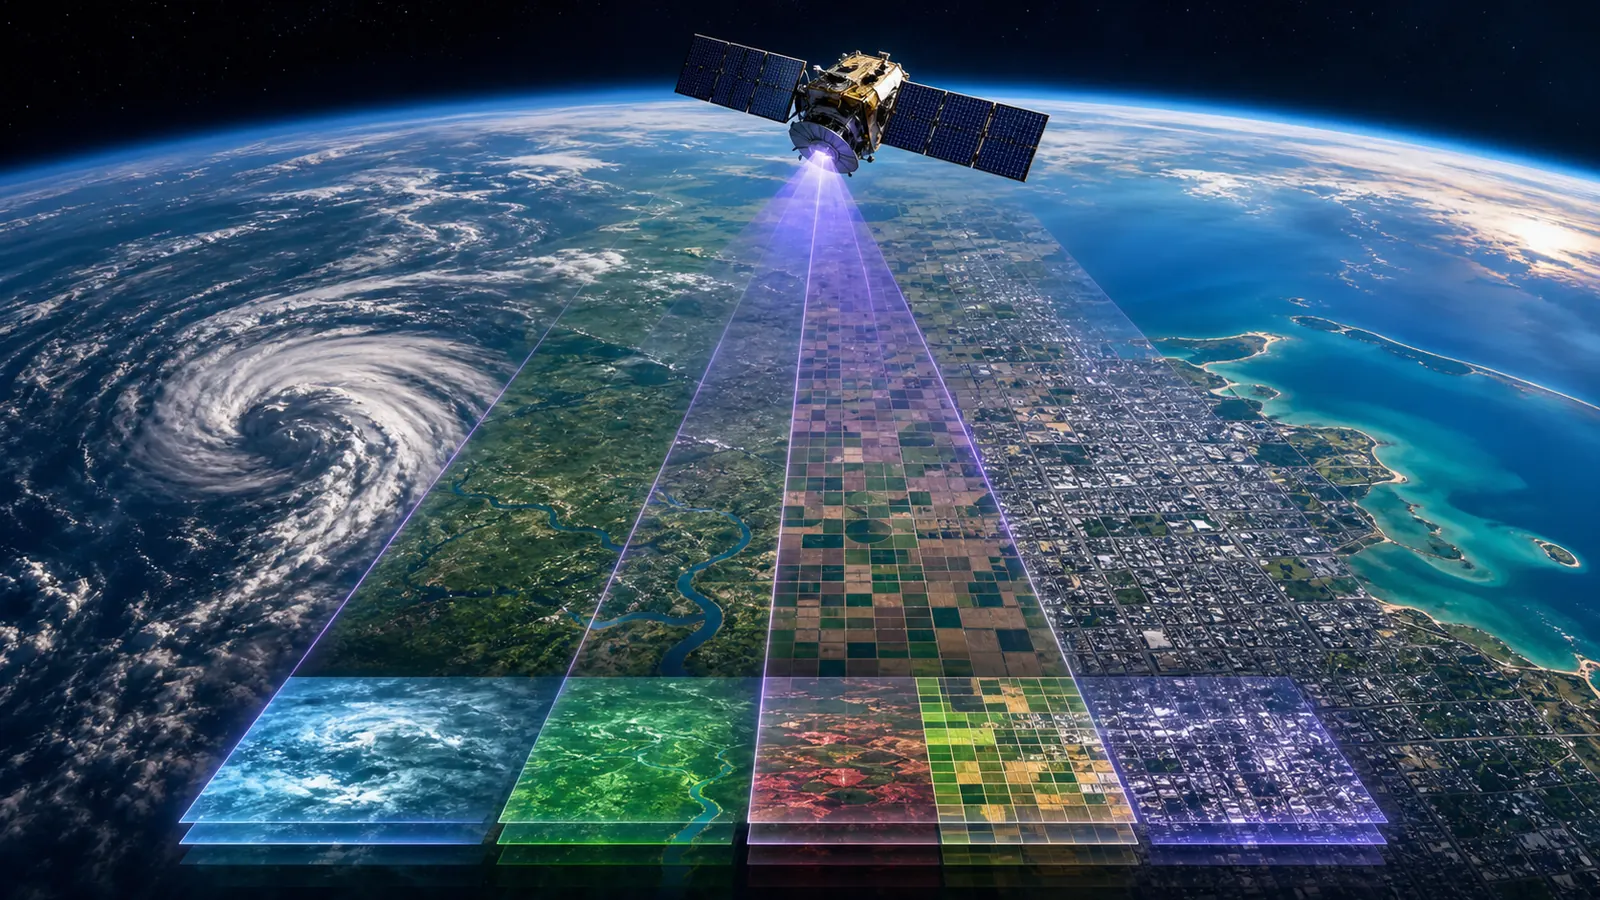
World Explained · Space and Earth
Satellite images trade detail for coverage, timing and wavelength. A house-size pixel can reveal change across a region without resolving a face in the garden.

World Explained · Food science
The tear-inducing molecule is assembled when cutting ruptures separate compartments inside onion cells. Your eyes are reacting to newly made chemical defence.
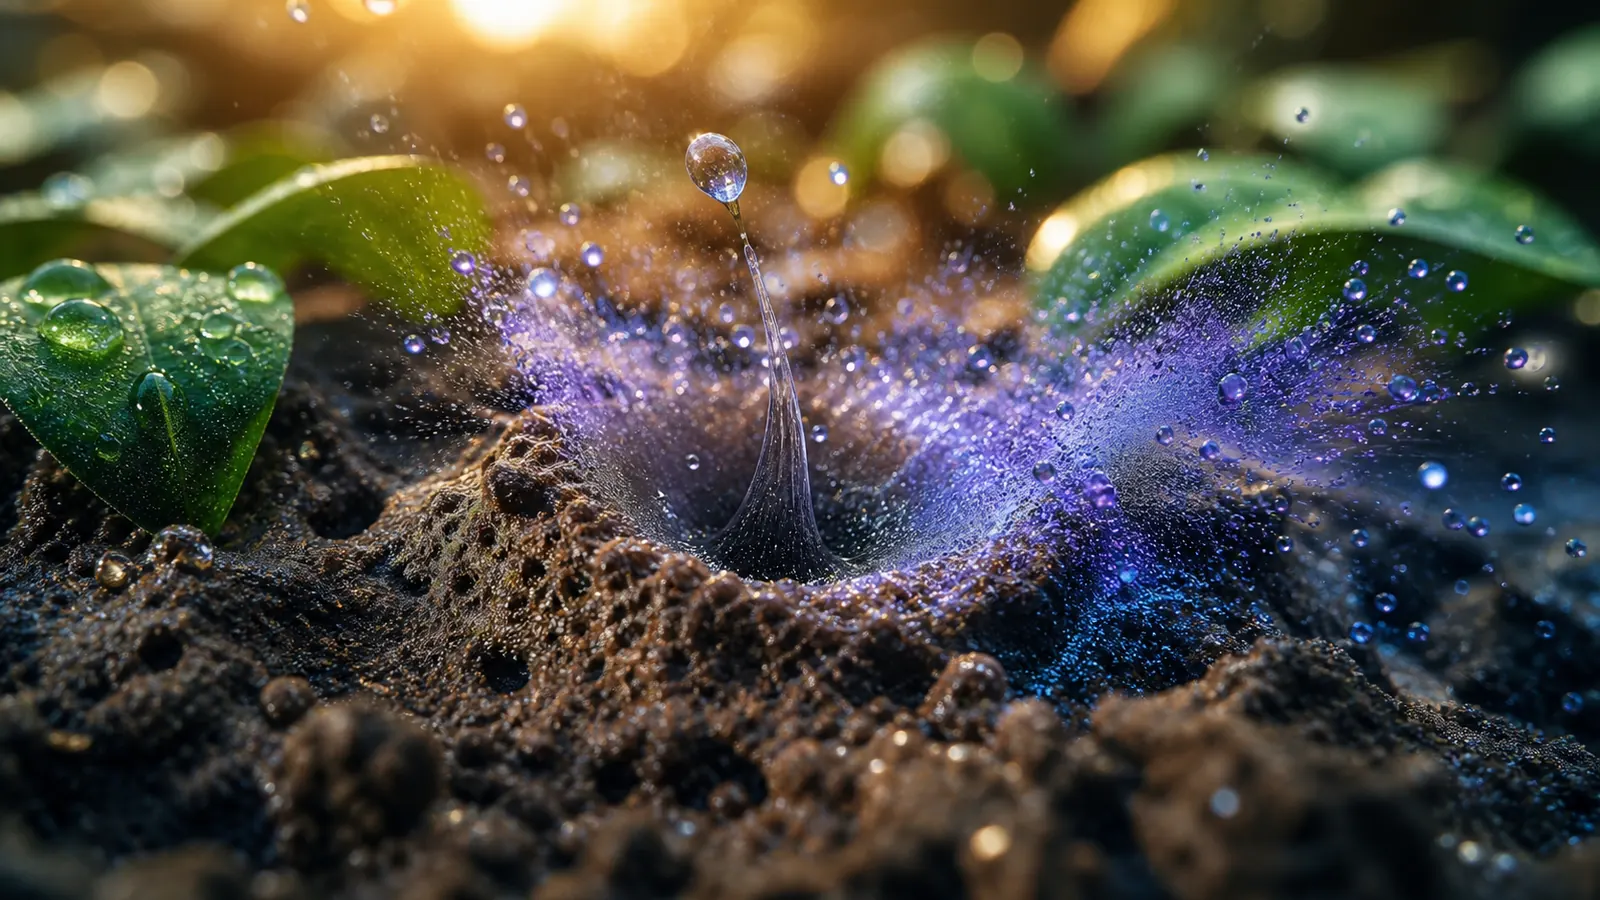
World Explained · Everyday science
Petrichor is not simply wet dirt. Raindrops can trap bubbles in porous ground and fire microscopic aerosols carrying earthy compounds toward your nose.
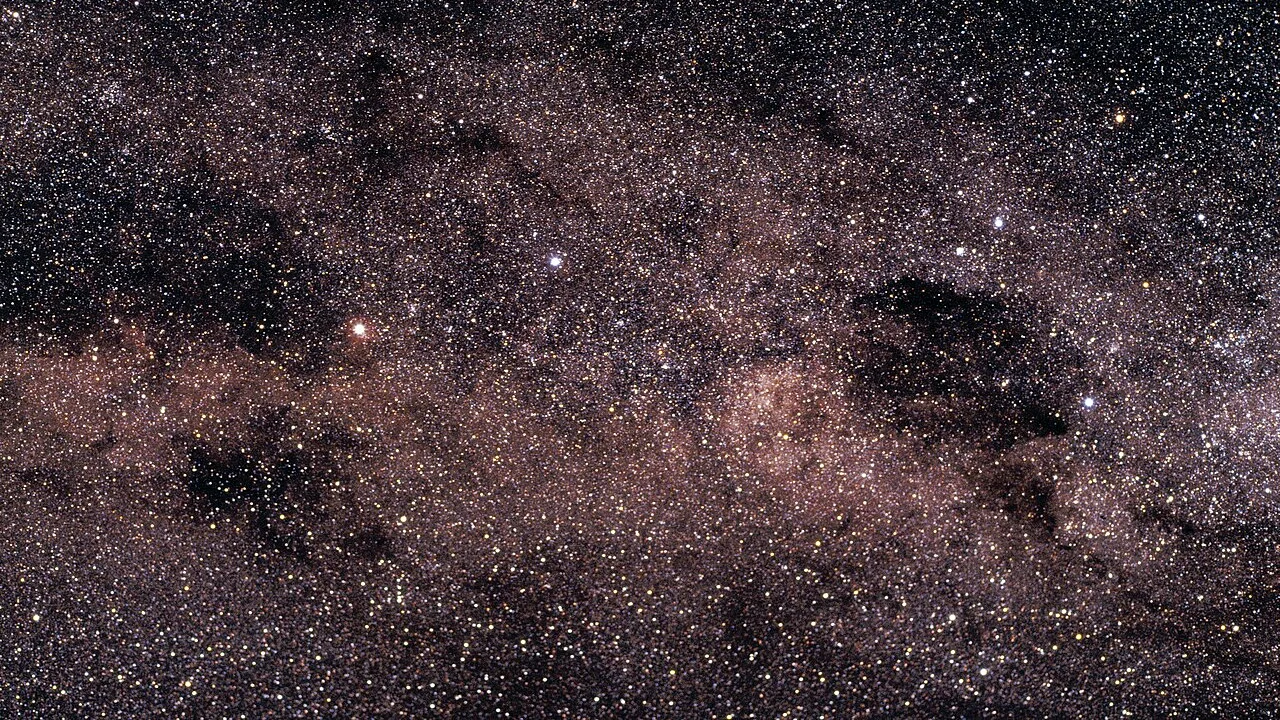
Australian Curiosity · Night sky
Crux is a measuring tool rather than a compass needle. Its long axis helps locate an invisible point above true south.
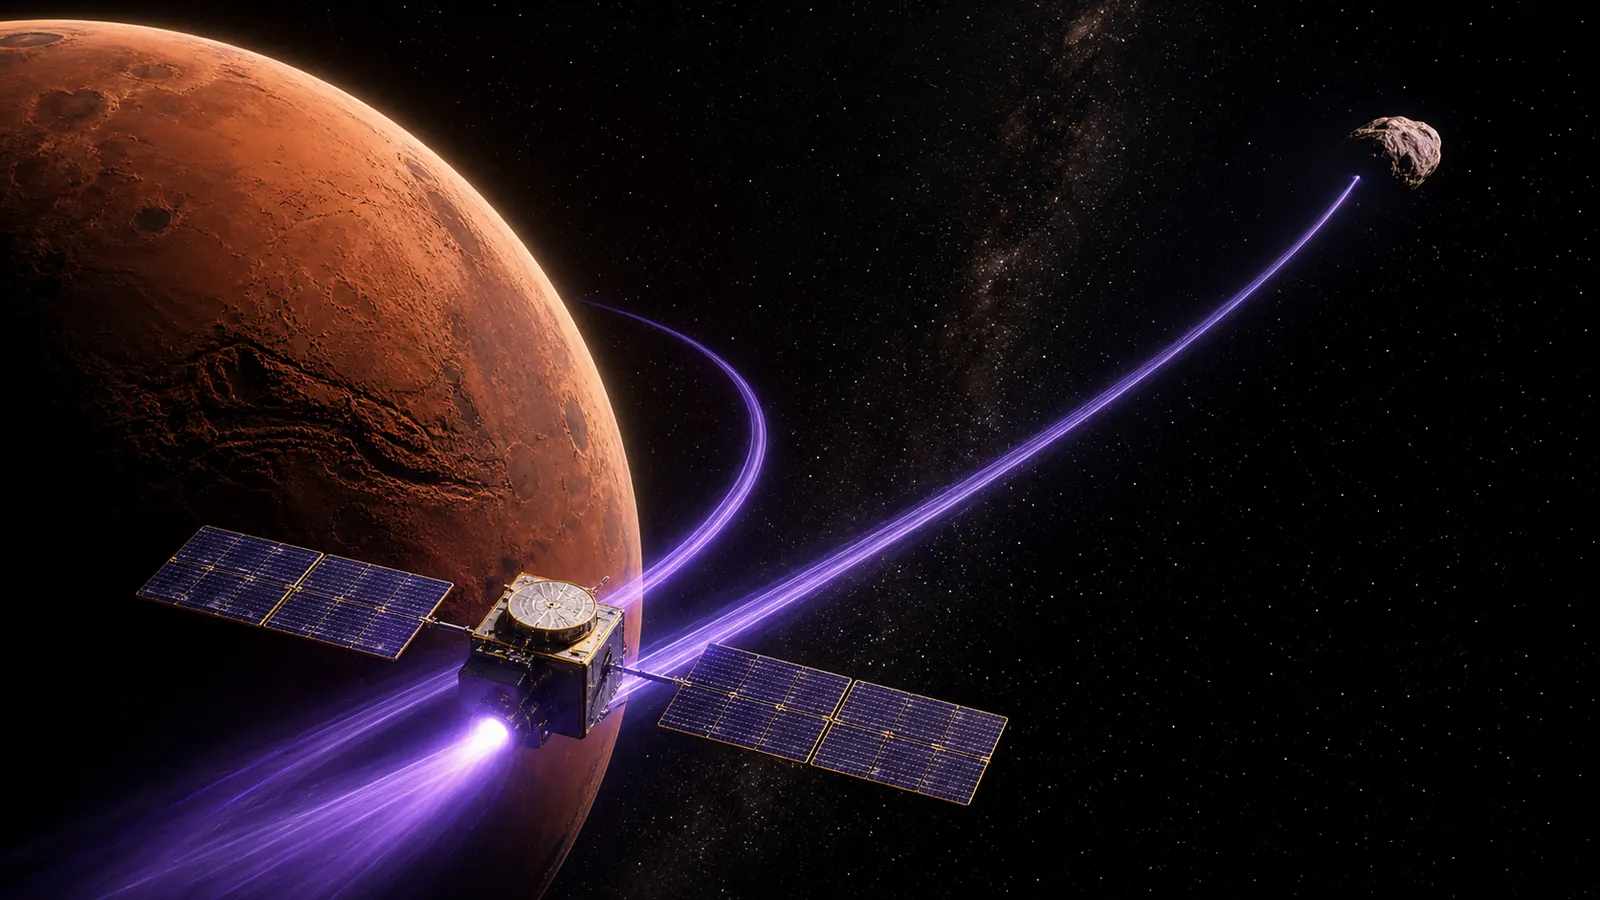
World Explained · Space
NASA's Psyche spacecraft used Mars to change speed and direction without a large propellant burn, then turned the flyby into a rehearsal for a metal-world mission.
World Explained · Weather and climate
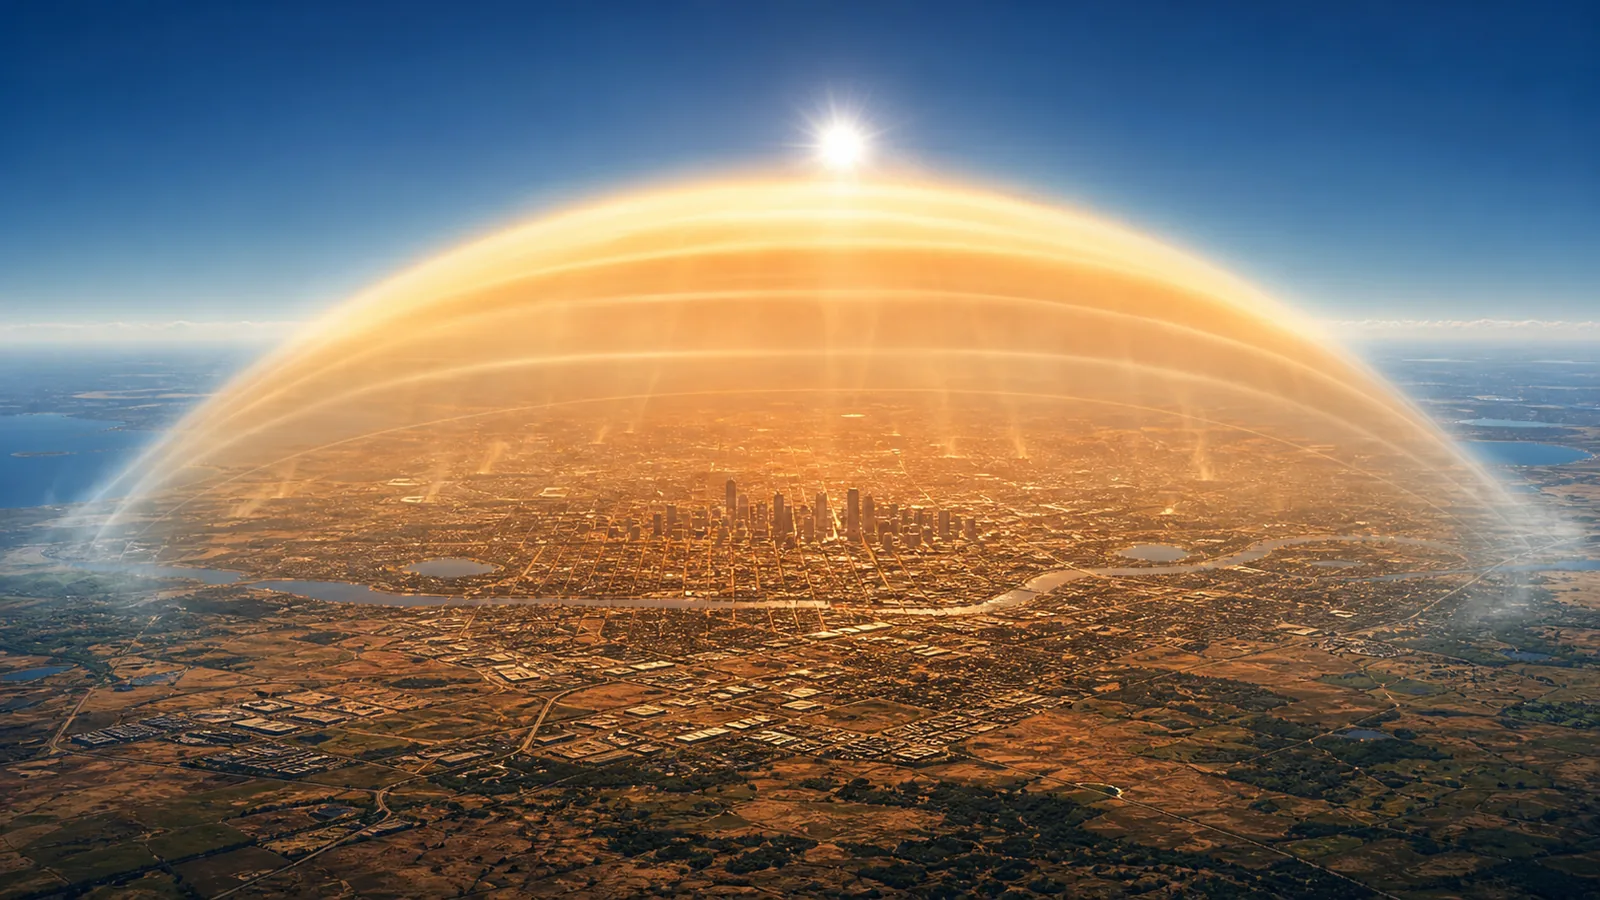
A heat dome is not a lid in the sky. It is a persistent high-pressure pattern that keeps air sinking and lets heat build. Here is why cooler nights matter.
World Explained · Everyday science
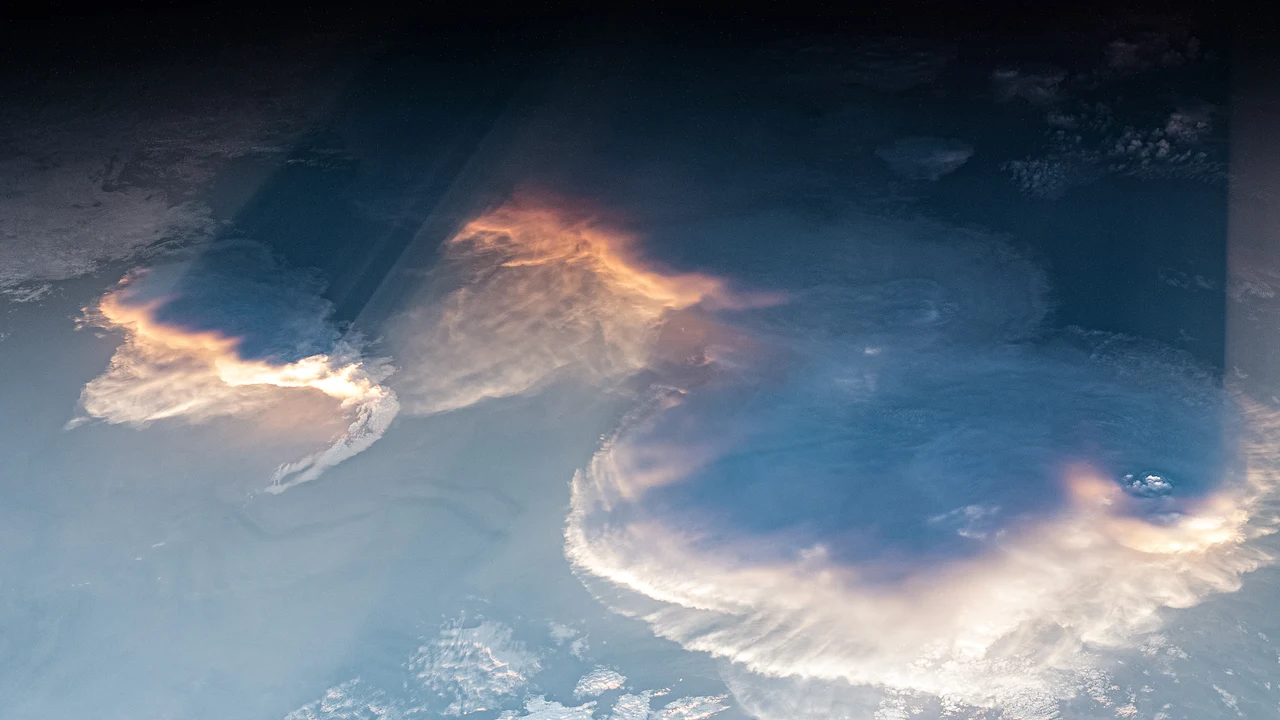
The blue daytime sky and the red sunset are two views of the same scattering process. The difference is the path sunlight takes before it reaches your eyes.

Better Home · Cleaning science
A disinfectant only matches its tested use when the right surface stays visibly wet for the full contact time on the label. A fast spray and wipe can clean without completing that process.
World Explained · Space and engineering
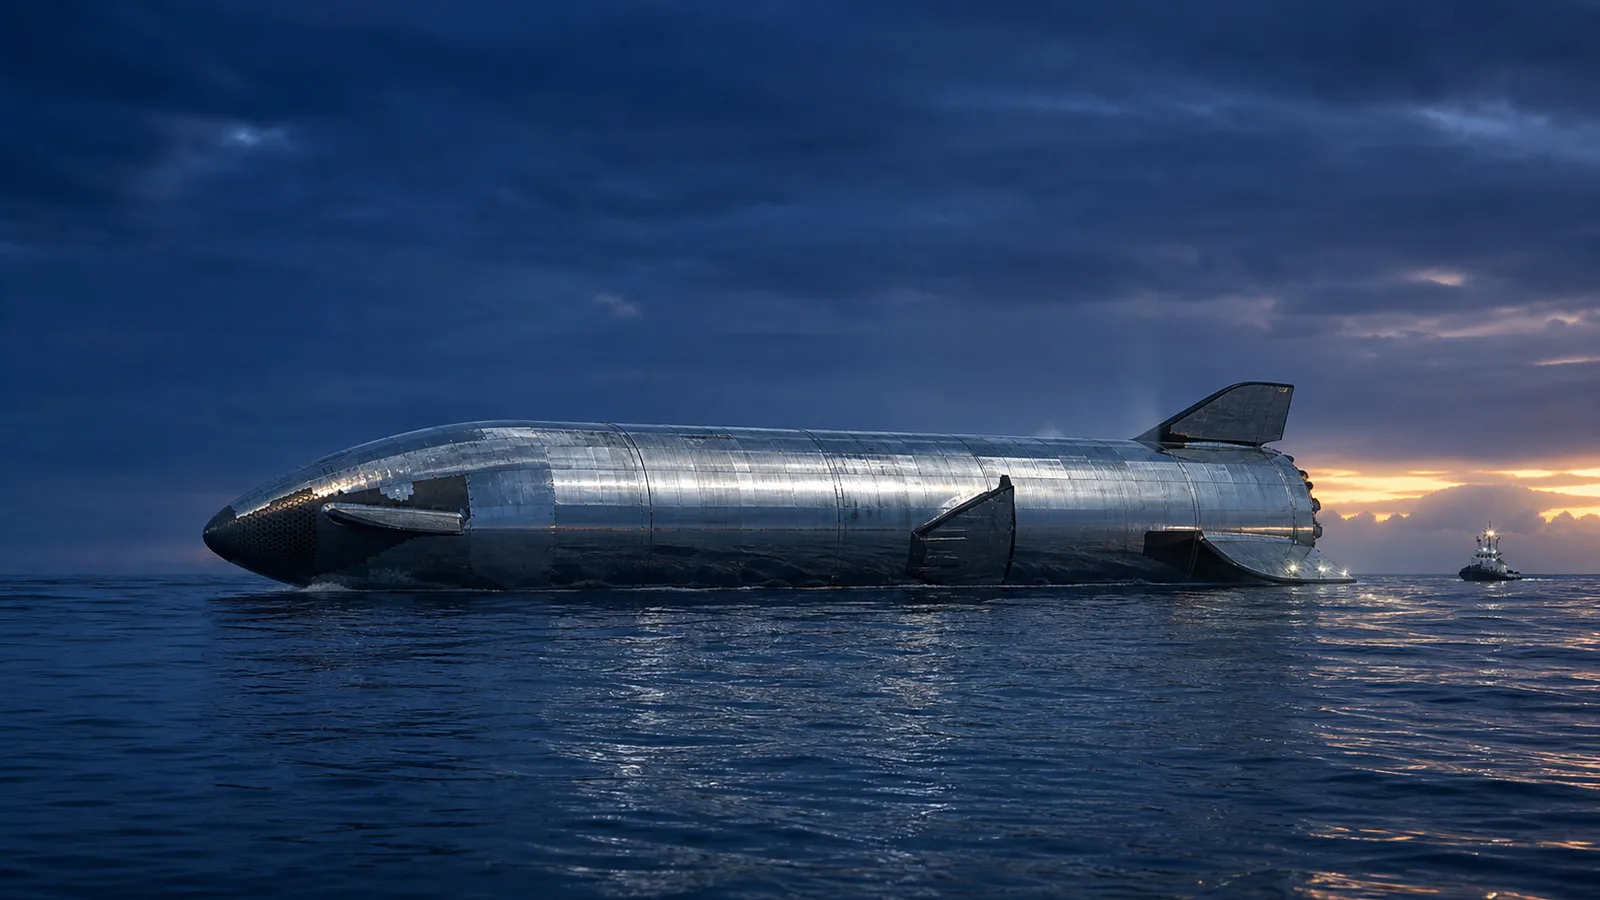
Starship's Flight 13 ended with an intact spacecraft floating at sea. Here is what the splashdown proved, what buoyancy explains and what remains unknown.
World Explained · Space
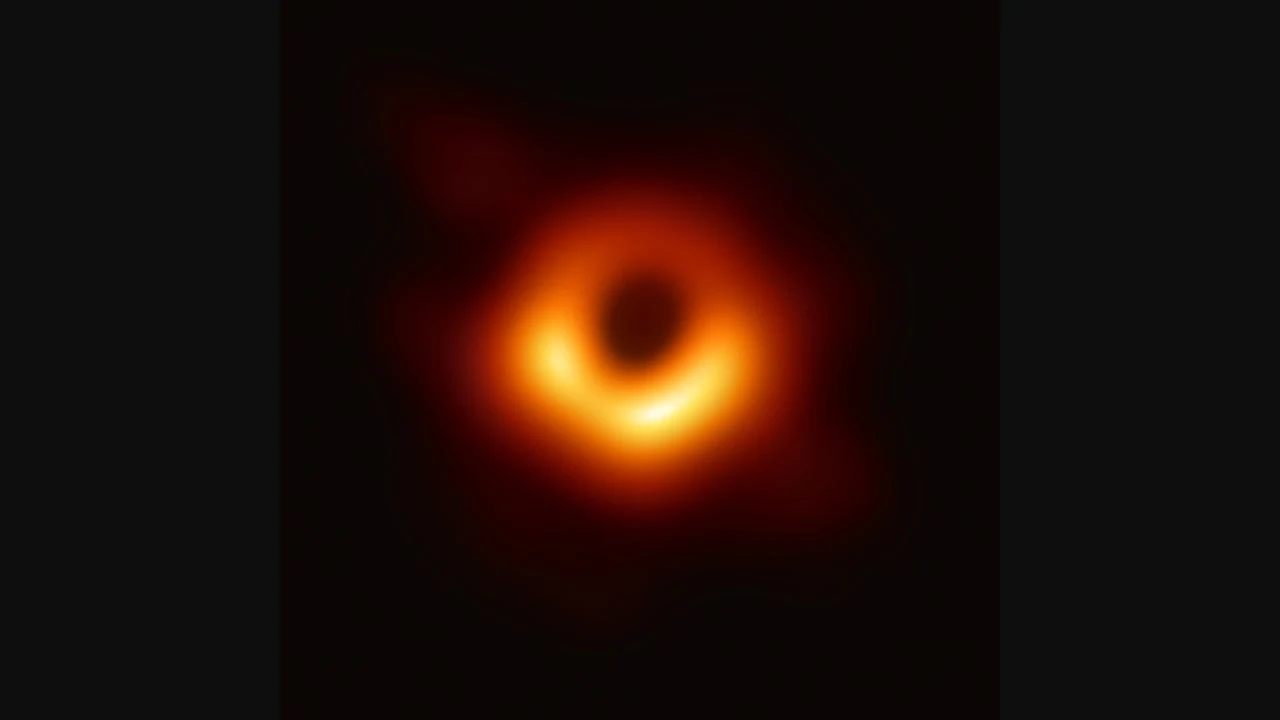
Black holes do not roam space sucking up everything nearby. Their gravity follows the same rules as any equal mass until an object ventures dangerously close.
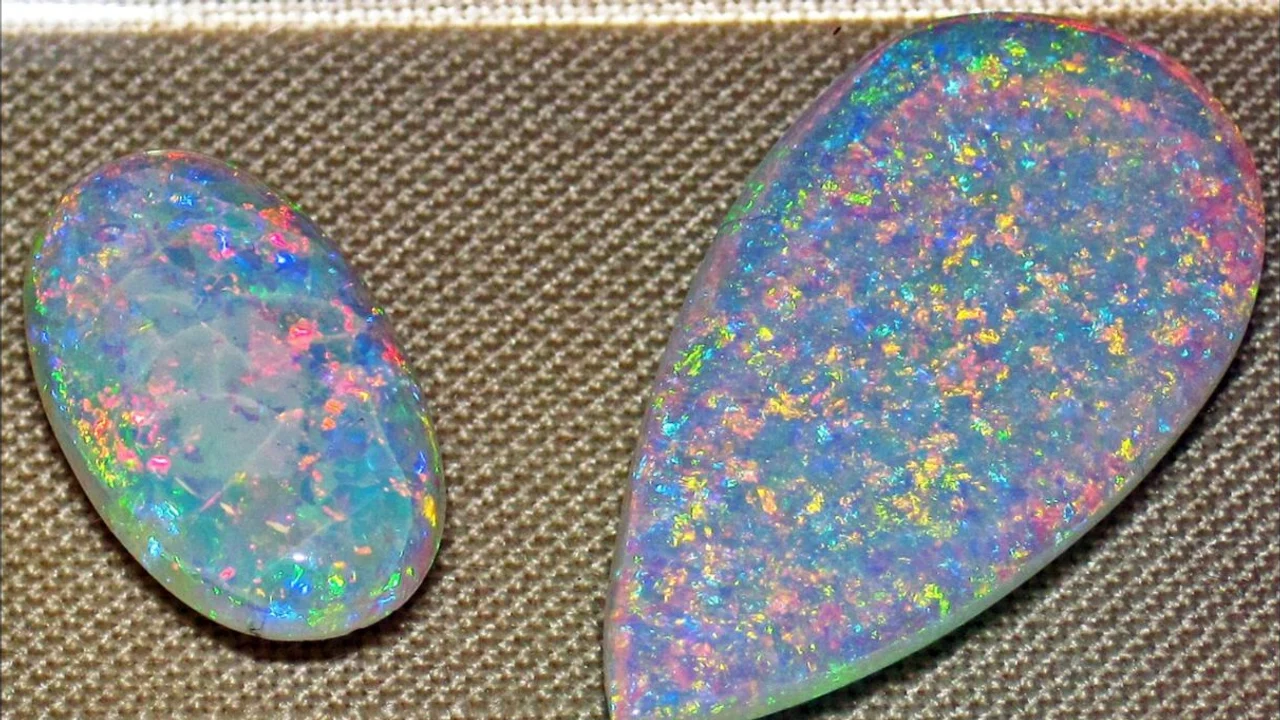
Australian Curiosity · Geology
A precious opal's colours are not pigments trapped in stone. A microscopic three-dimensional pattern sorts white light, then changes the result as the gem turns.
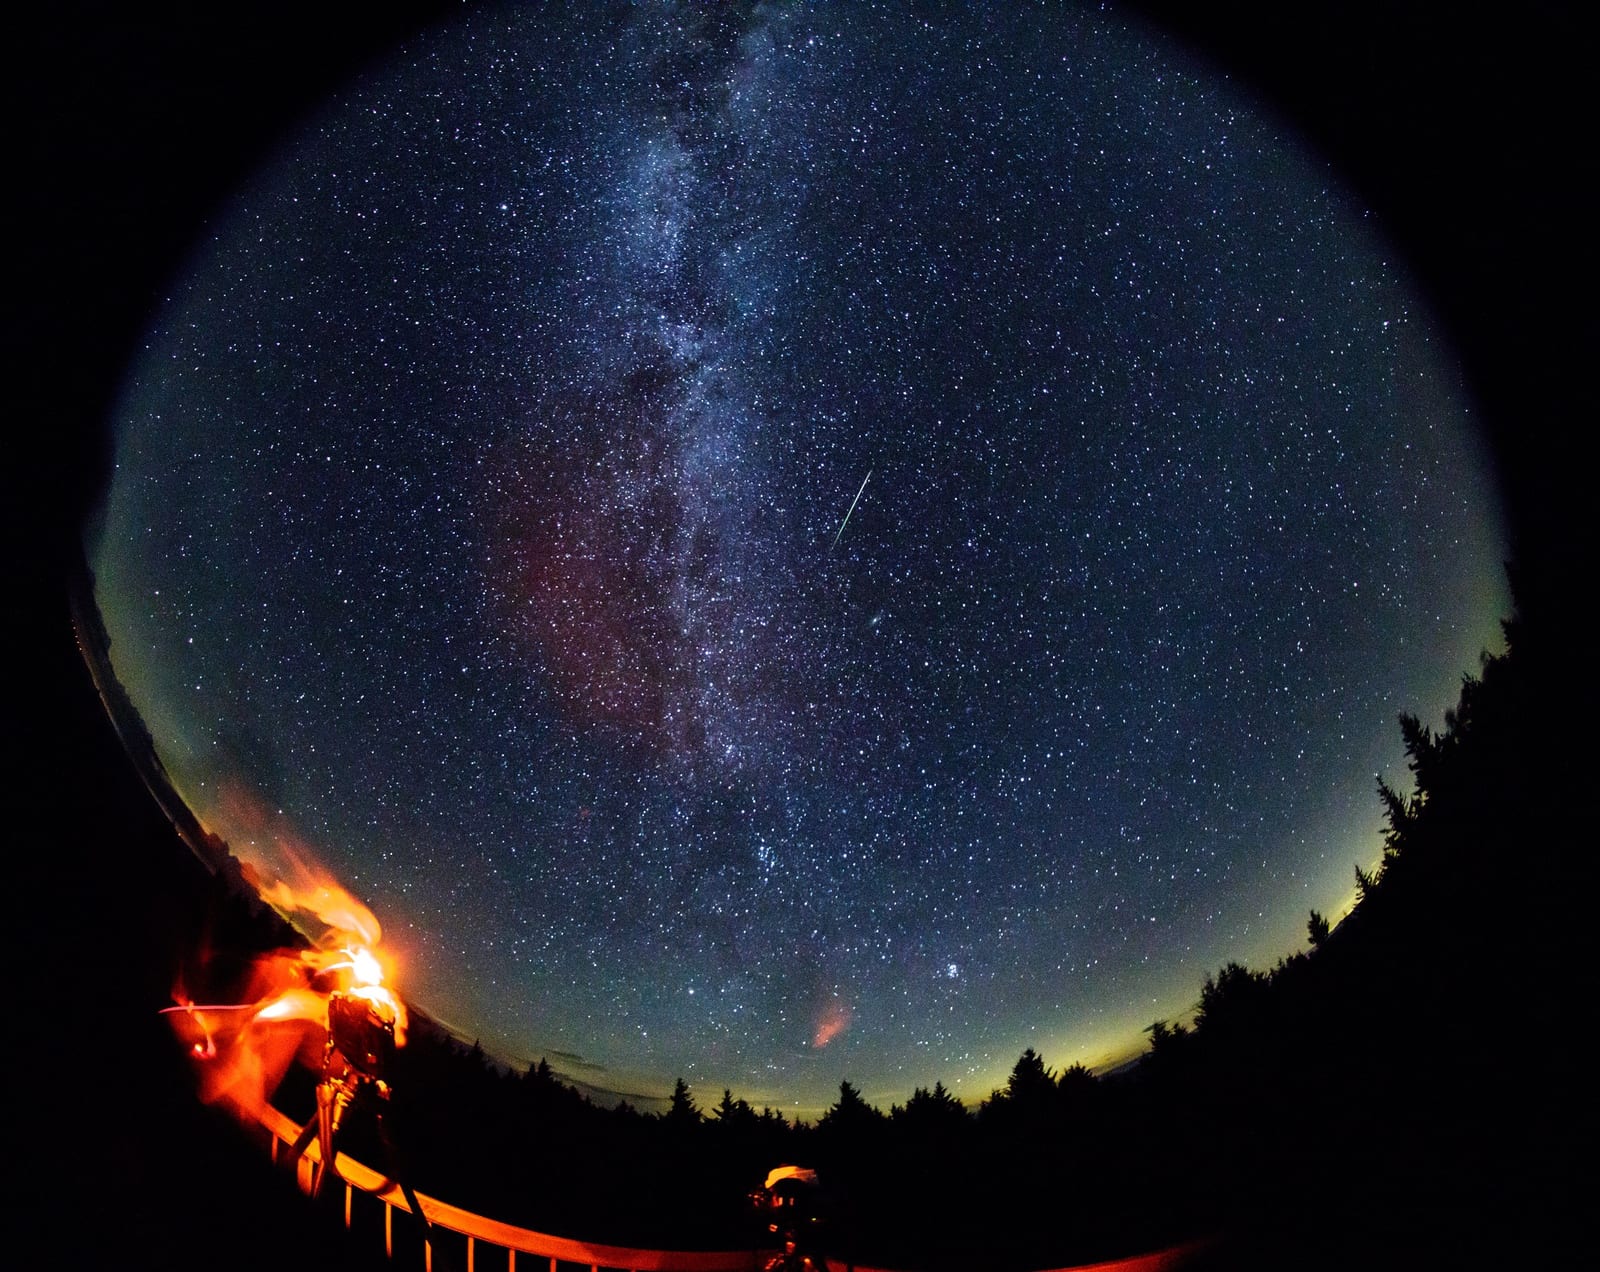
World Explained · Skywatching and space
Two meteor showers peak around 30 and 31 July, but a nearly full Moon will erase many faint streaks. Here is when to look and what you may actually see.
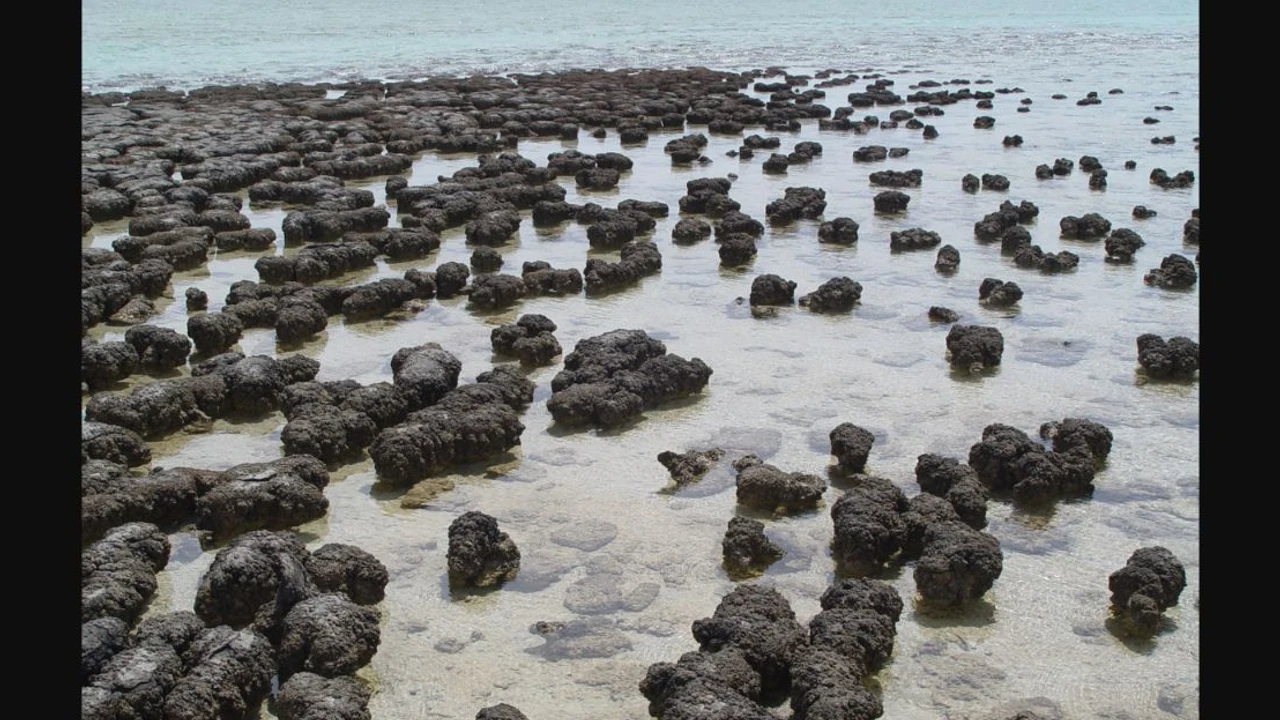
Australian Curiosity · Deep time
Hamelin Pool's rock-like mounds are being built by microbial communities today. They illuminate ancient processes without being unchanged survivors from early Earth.
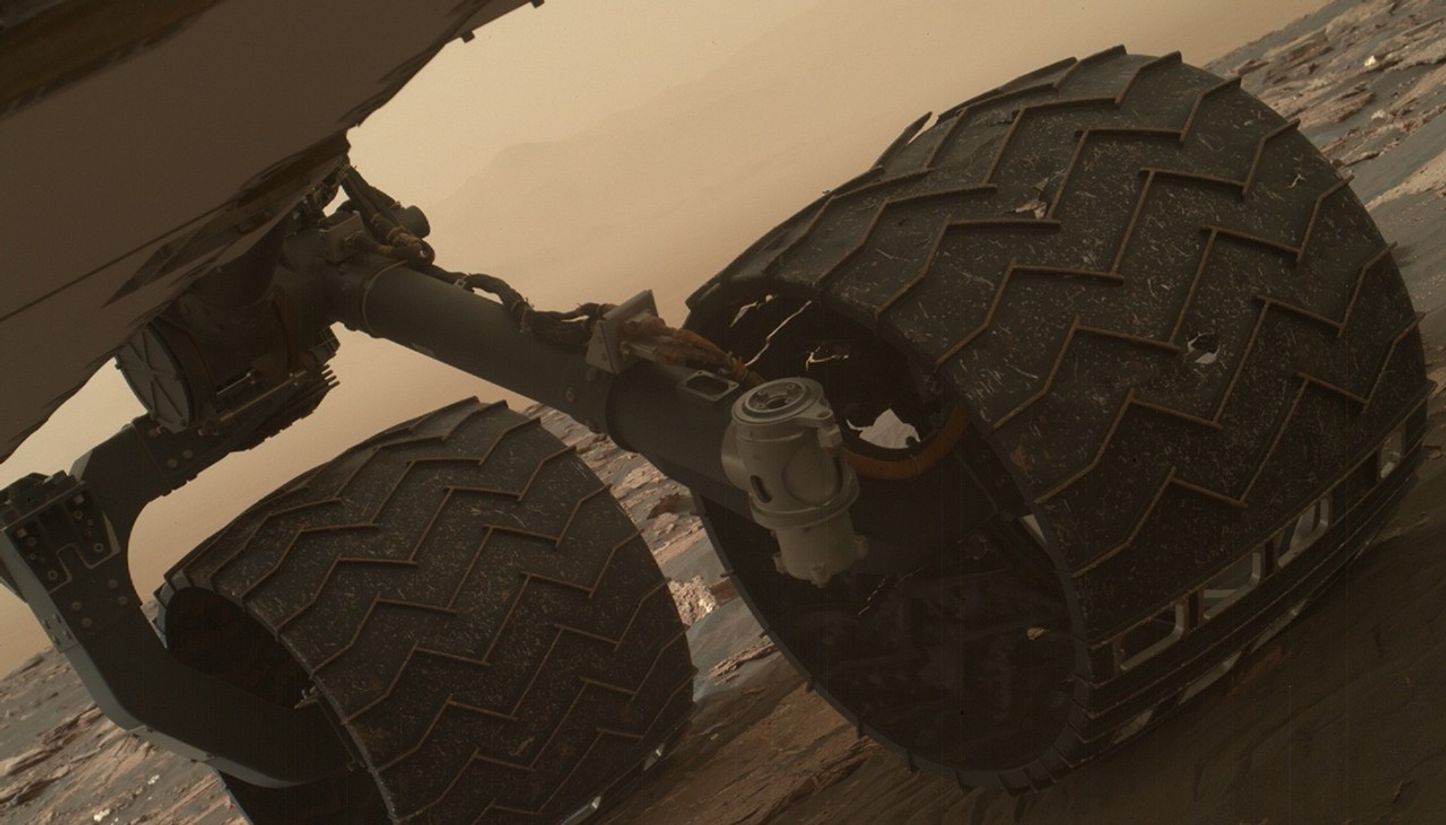
World Explained · Space Engineering
The holes look catastrophic, but Curiosity's thin aluminium skins, structural grousers and careful driving reveal why damaged does not mean disabled.
Australian Curiosity · Geology
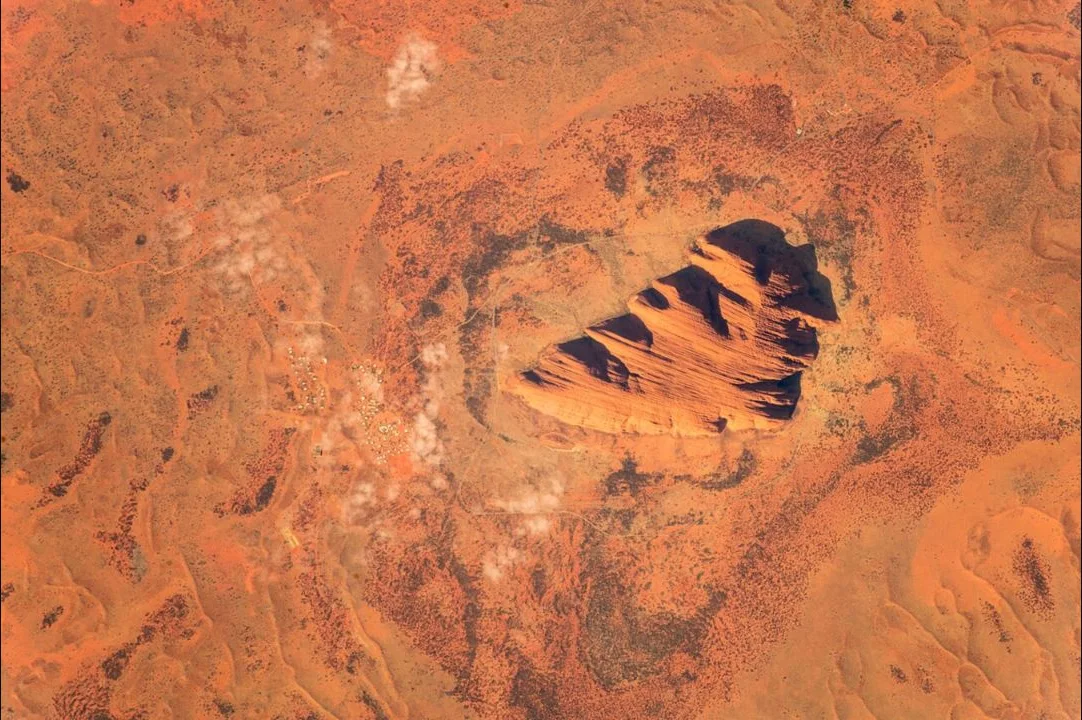
Uluṟu's famous red is a weathered skin. Fresh arkose is greyish, while iron at the exposed surface reacts with oxygen and forms rust.
World Explained · Space
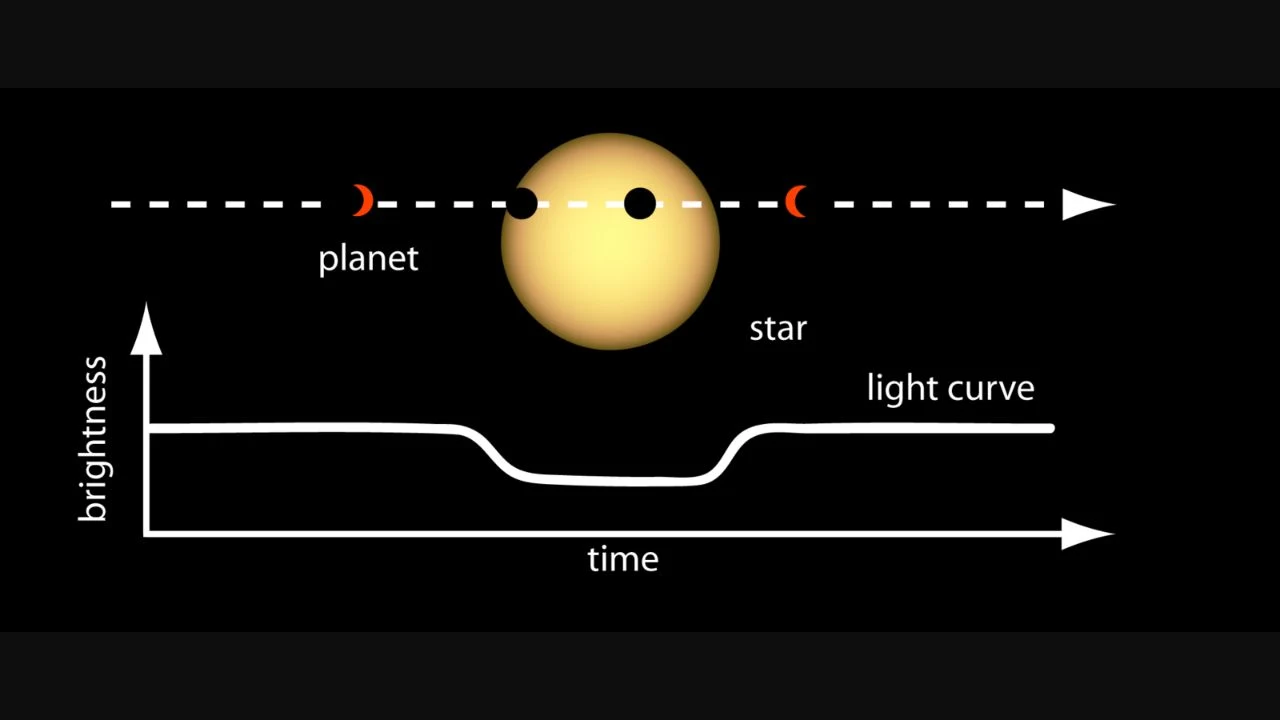
A planet can remain an unresolved point beside its star yet betray itself through a repeating dip in starlight. The dip reveals an orbit and size, but only after careful checks.
Better Home · Cleaning science
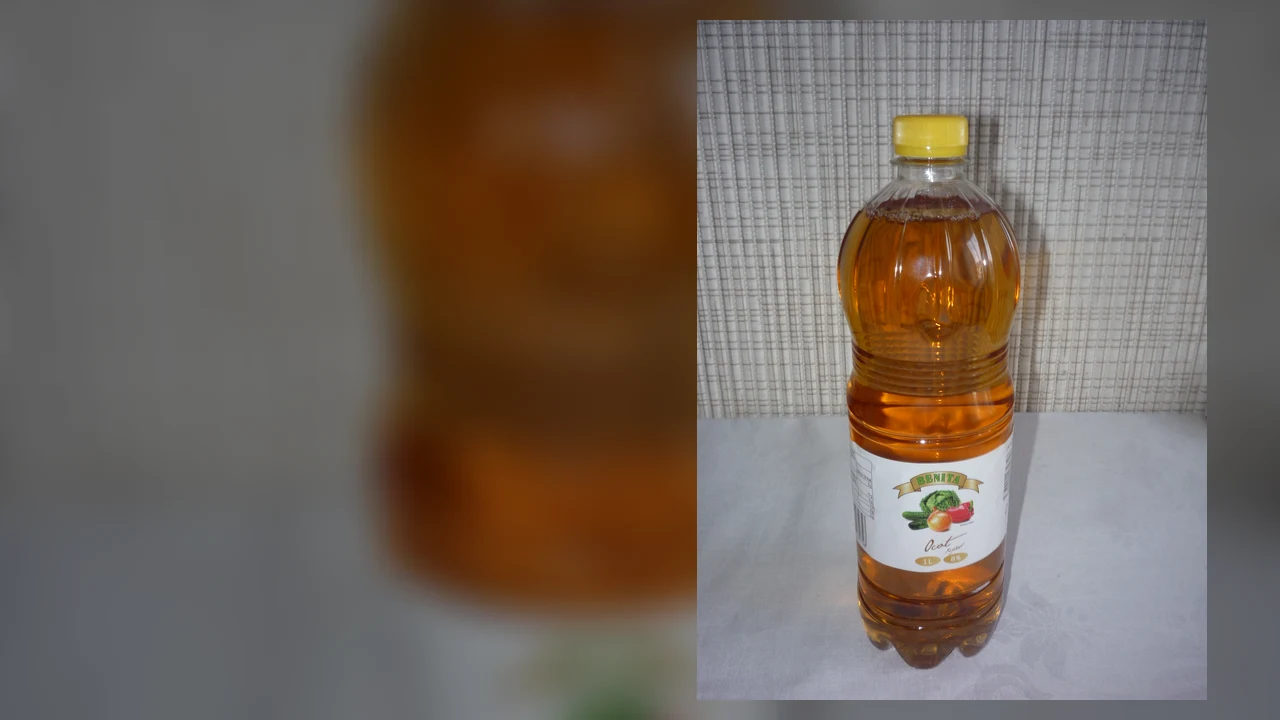
Vinegar can dissolve some mineral deposits, but the same acid can etch stone, dull finishes, damage appliance parts and react dangerously with bleach.
Australian Curiosity · Ocean science
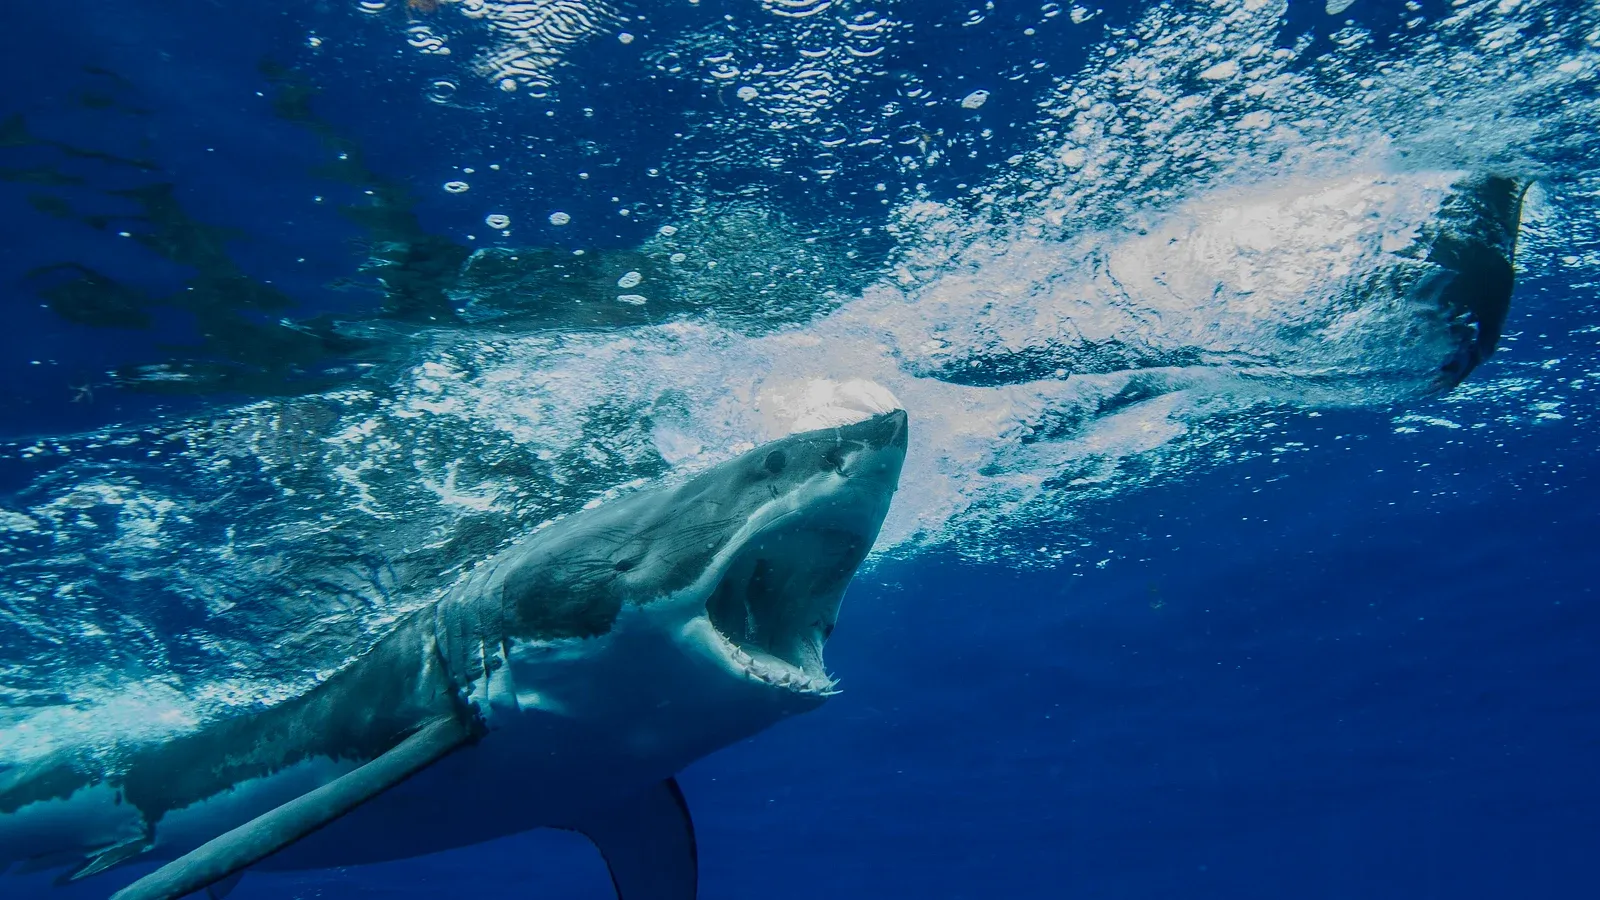
Cameras fitted to 13 juvenile white sharks off New South Wales recorded long stretches over sand and just 20 bursts of speed. None ended in a documented prey capture.
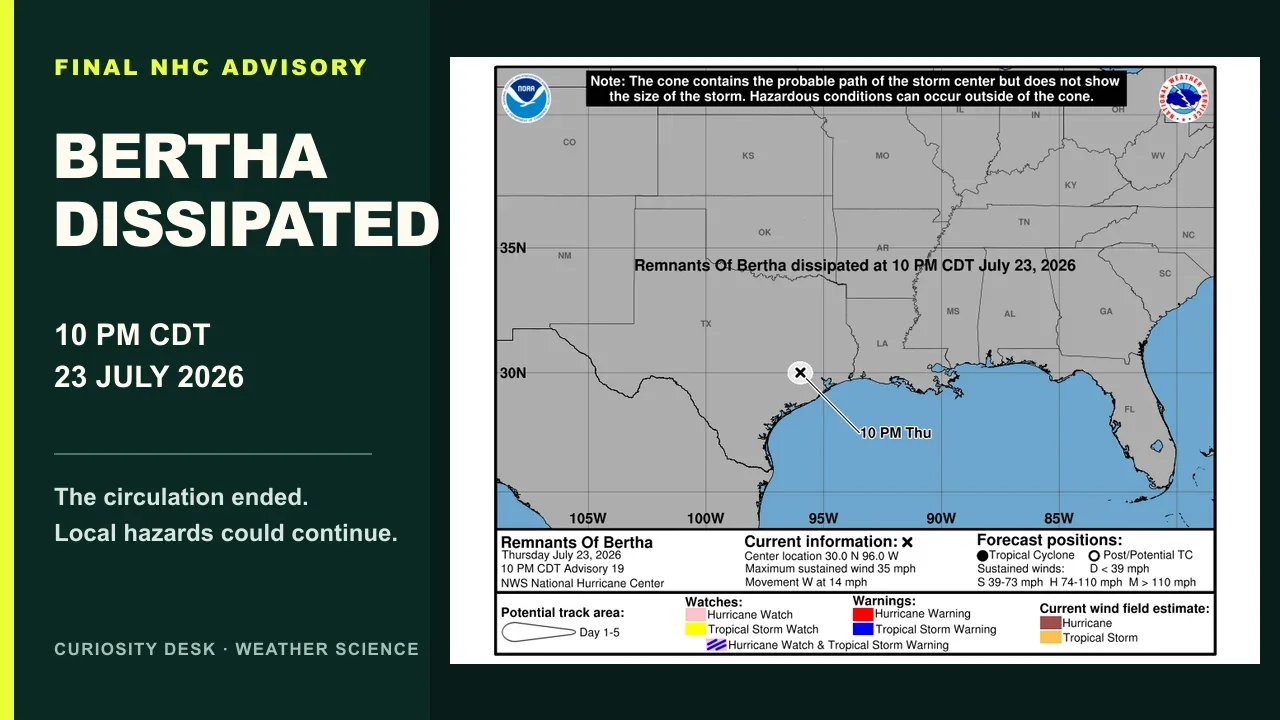
World Explained · Weather science
The final advisory says Bertha lost its closed circulation near Houston. Rain, surf and local warnings can continue after a tropical cyclone dissipates.
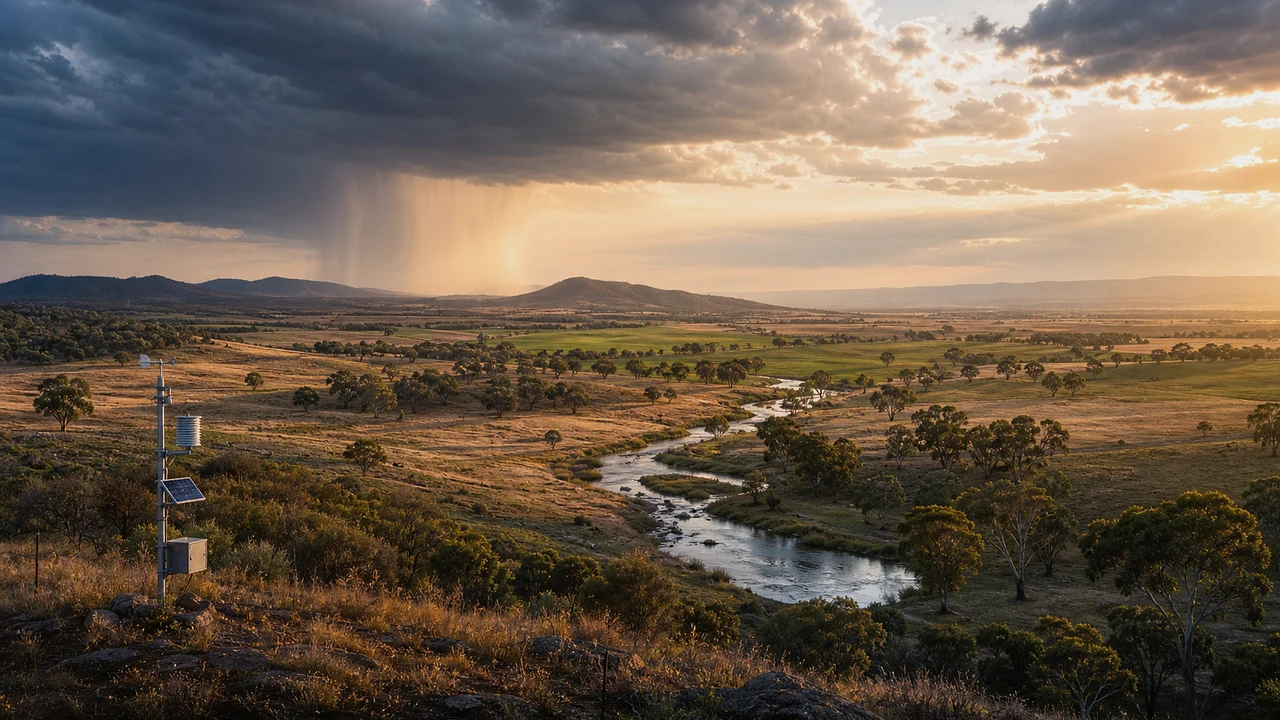
Australian Curiosity · Weather and climate
The Pacific has entered El Niño, but that does not make every Australian town dry. Here is what the current rainfall and temperature outlook means.
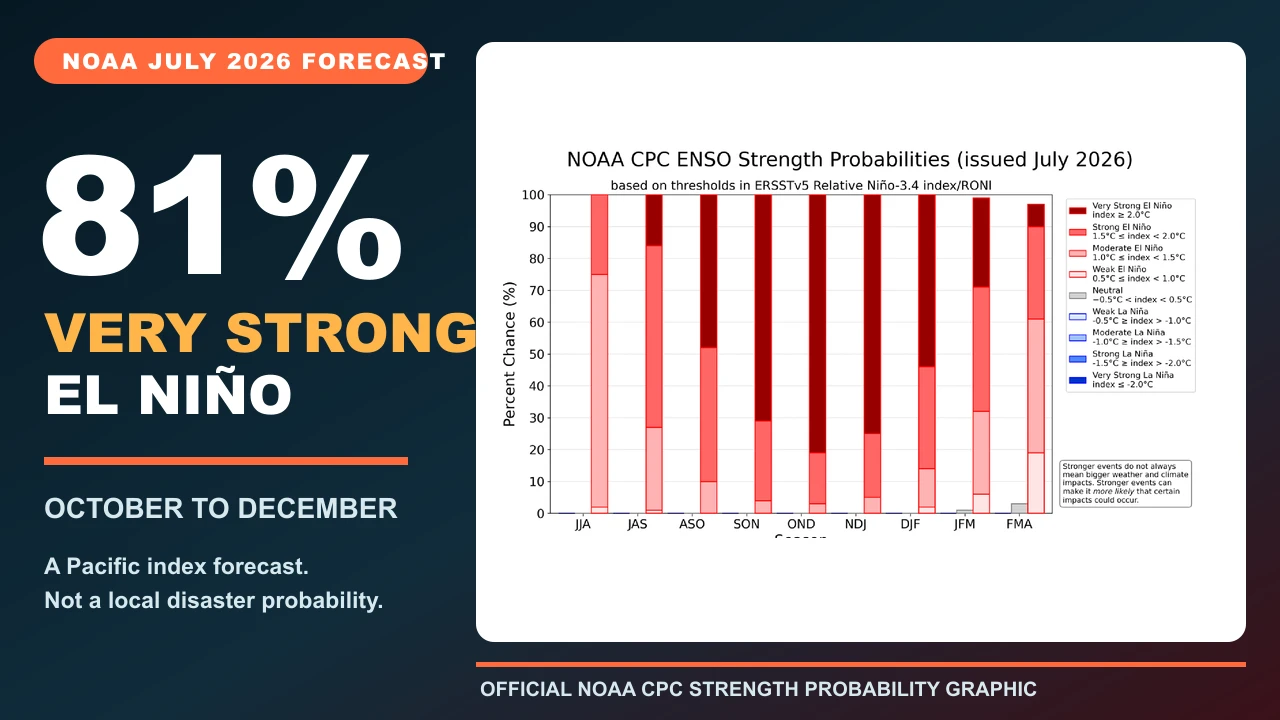
World Explained · Weather and climate
NOAA gives an 81% chance of a very strong El Niño in late 2026. Here is what that category measures, what “super” misses and what is not guaranteed.
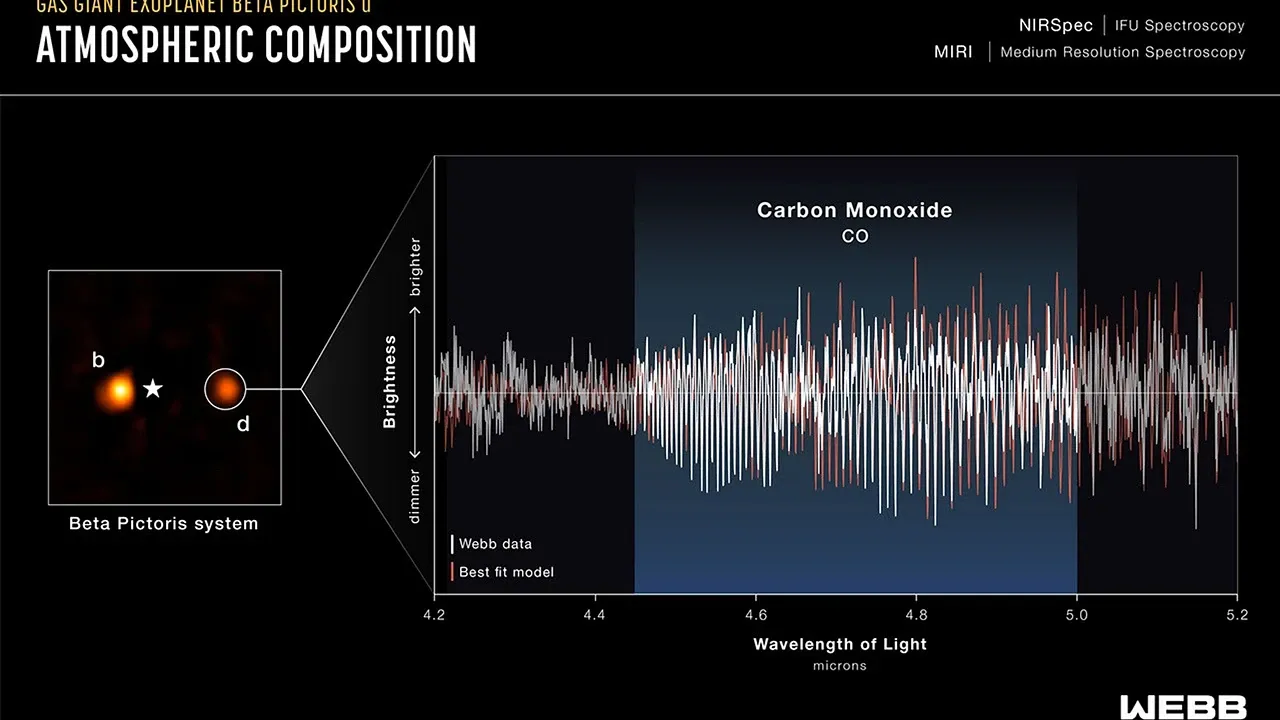
World Explained · Space
Beta Pictoris d was concealed by a bright debris disk. Webb separated it from the glare by finding molecules and motion inside a spatially resolved spectrum.
World Explained · Earth from space
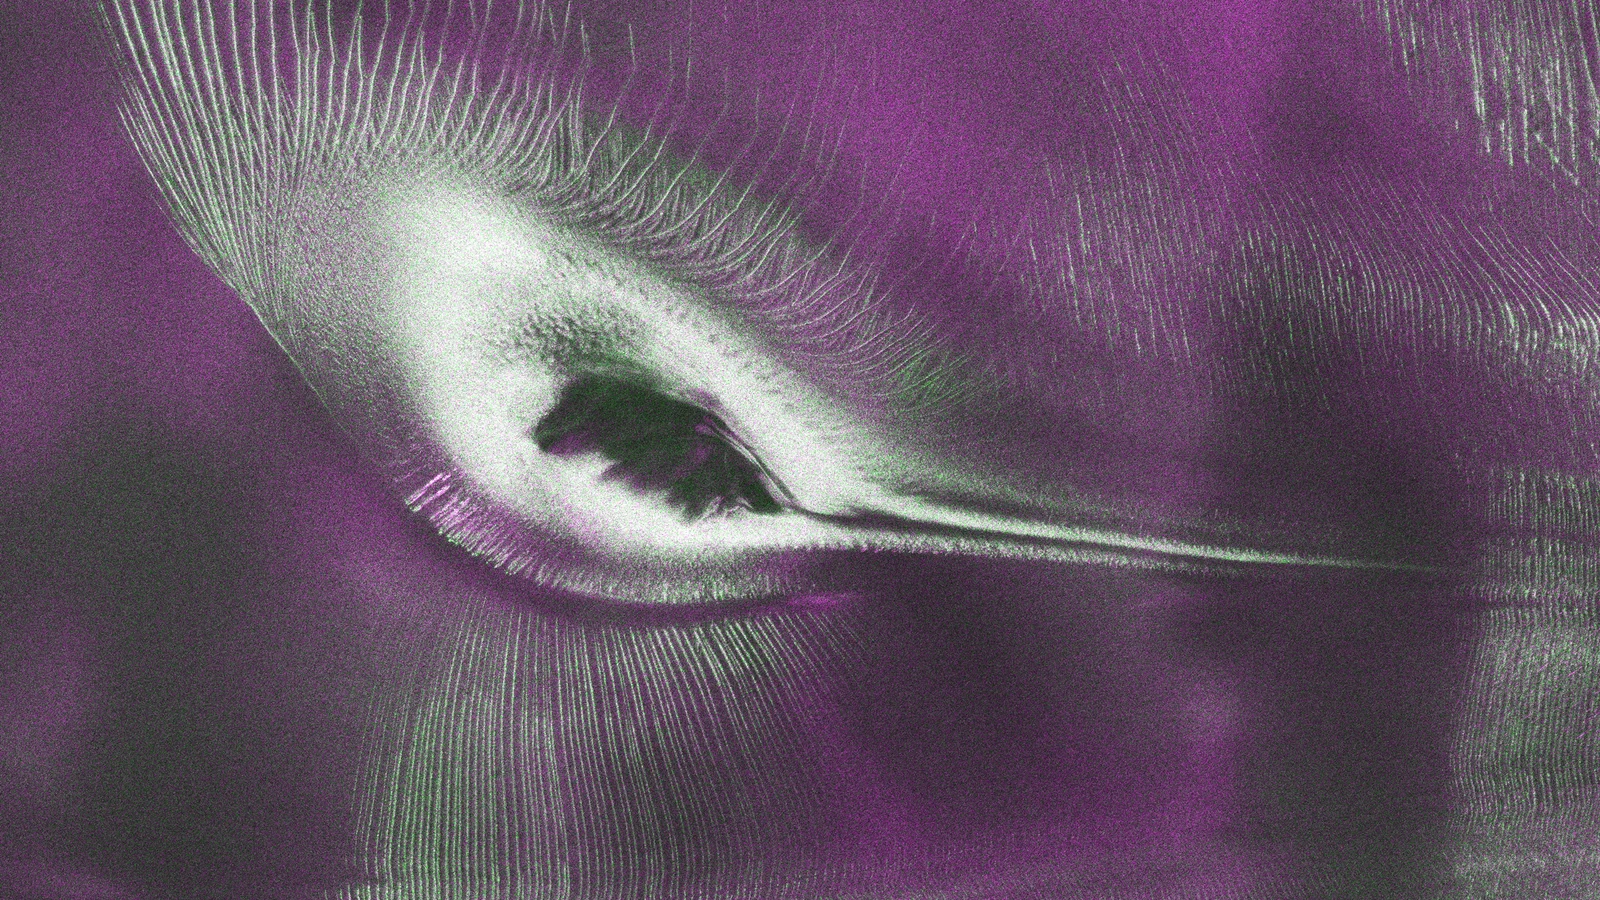
NASA's Antarctic radar image looks like a bird in flight. Its green 'feathers' are crevasses, and the colours reveal how ice returned microwave signals.
World Explained · Materials
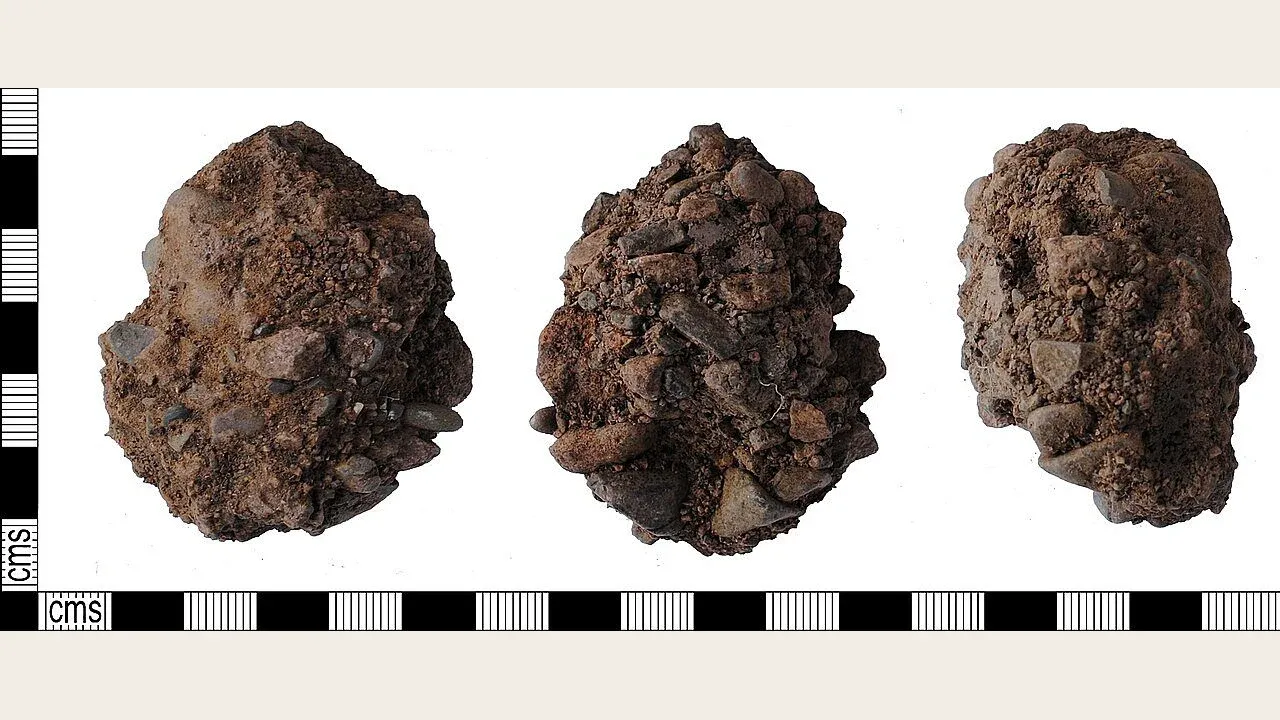
White lumps once blamed on careless mixing may be part of the reason some Roman concrete survived. When water enters a crack, the material can help seal it again.
World Explained · Space
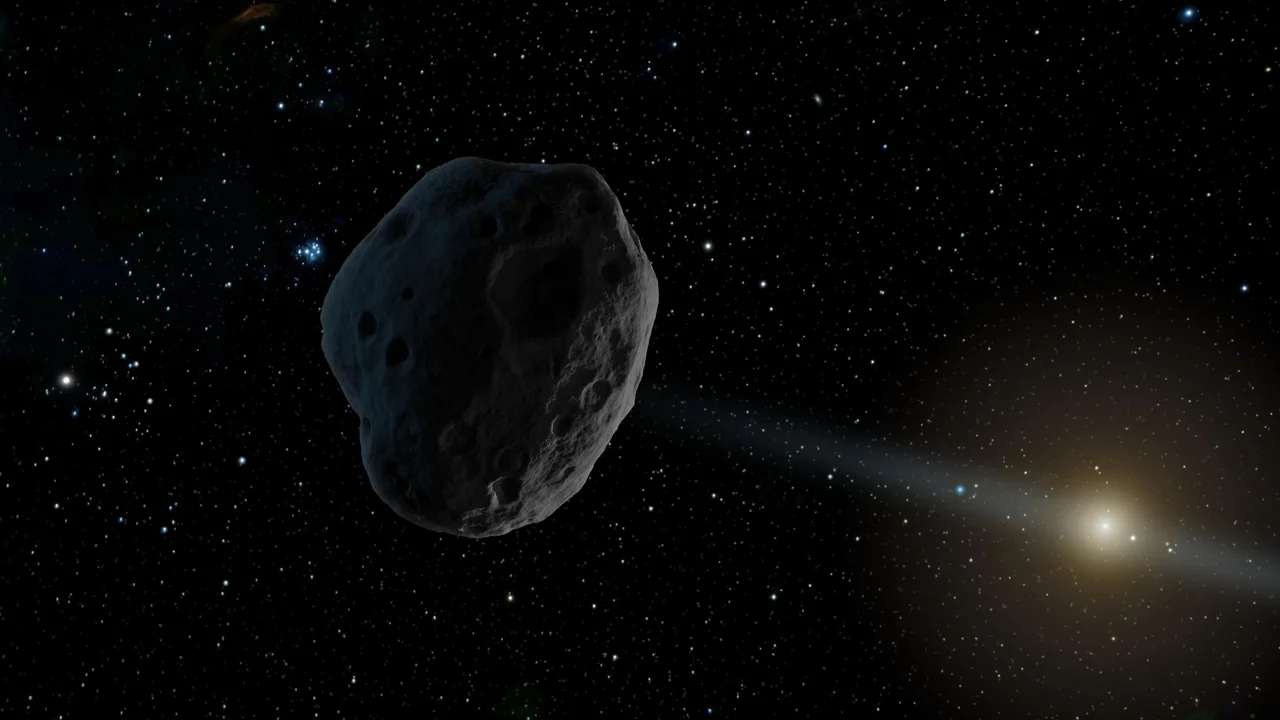
A near-Earth object failed to appear where gravity predicted. Its tiny unexplained push led astronomers to a faint tail and a new identity.
World Explained · Space
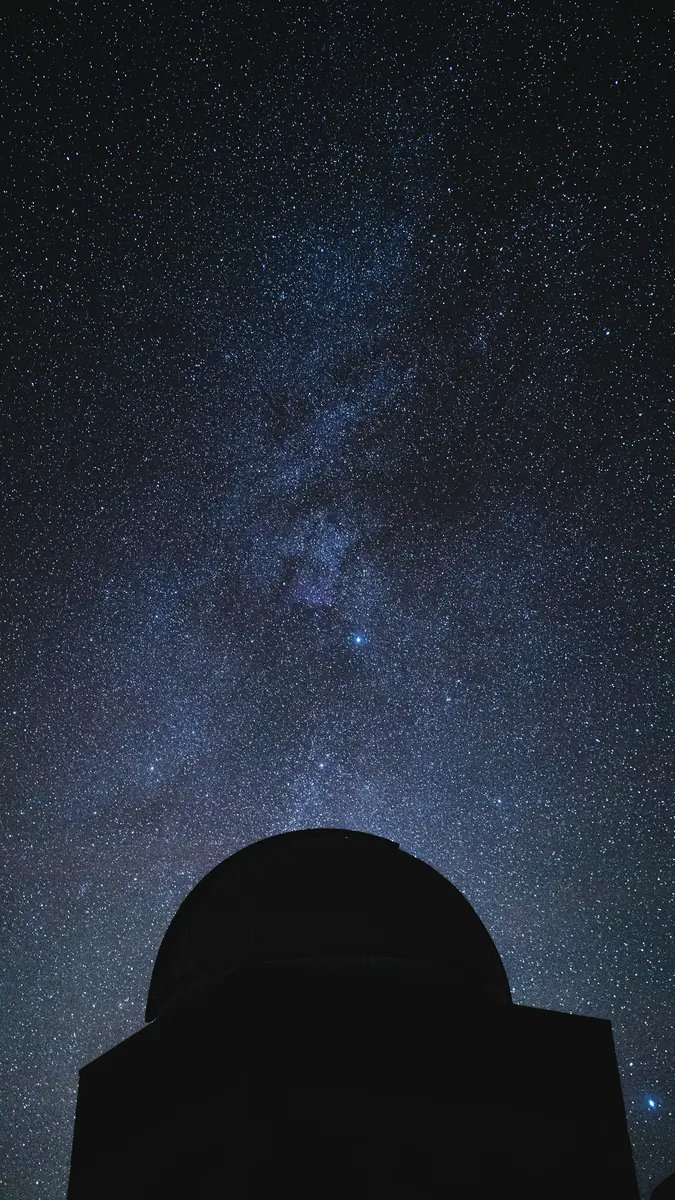
Look in any direction far enough and you meet the same ancient glow: light released when the universe first became transparent, about 380,000 years after the big bang.
World Explained · Space
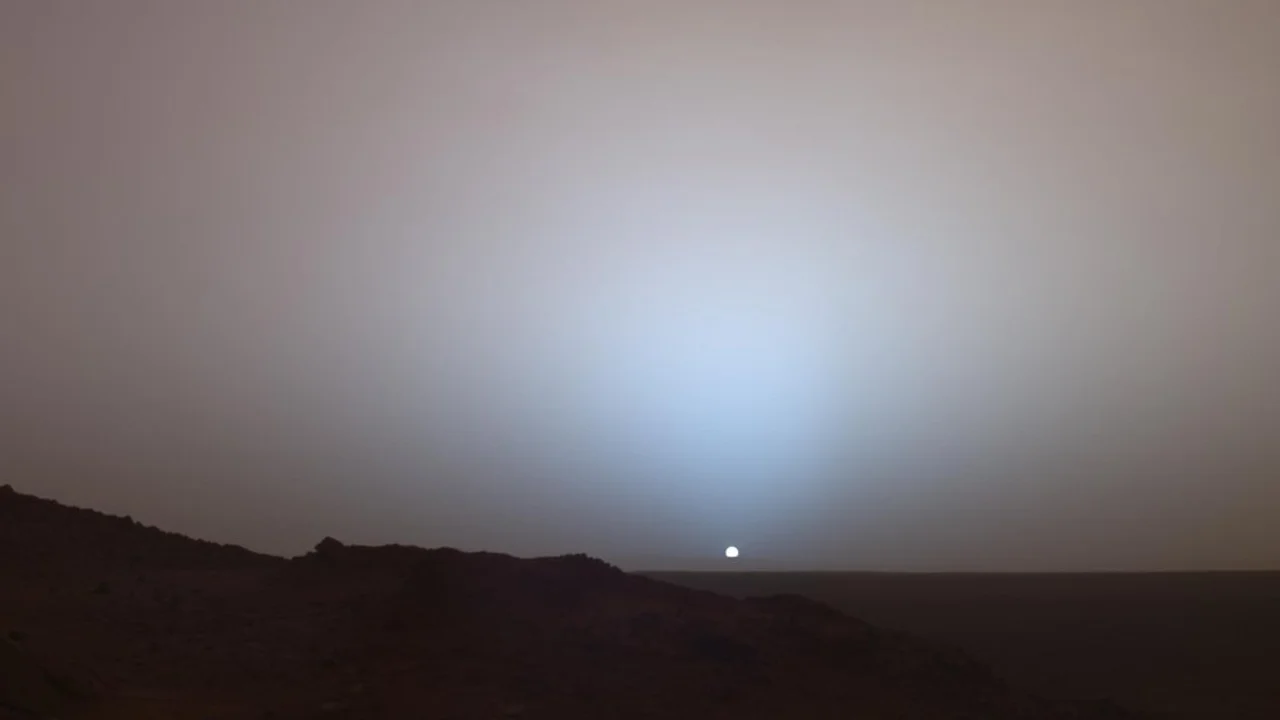
Does Mars have a blue sky? Usually not. Its dusty daytime sky looks tan to reddish, but a blue-grey halo can gather around the Sun at sunrise and sunset.
World Explained · Space
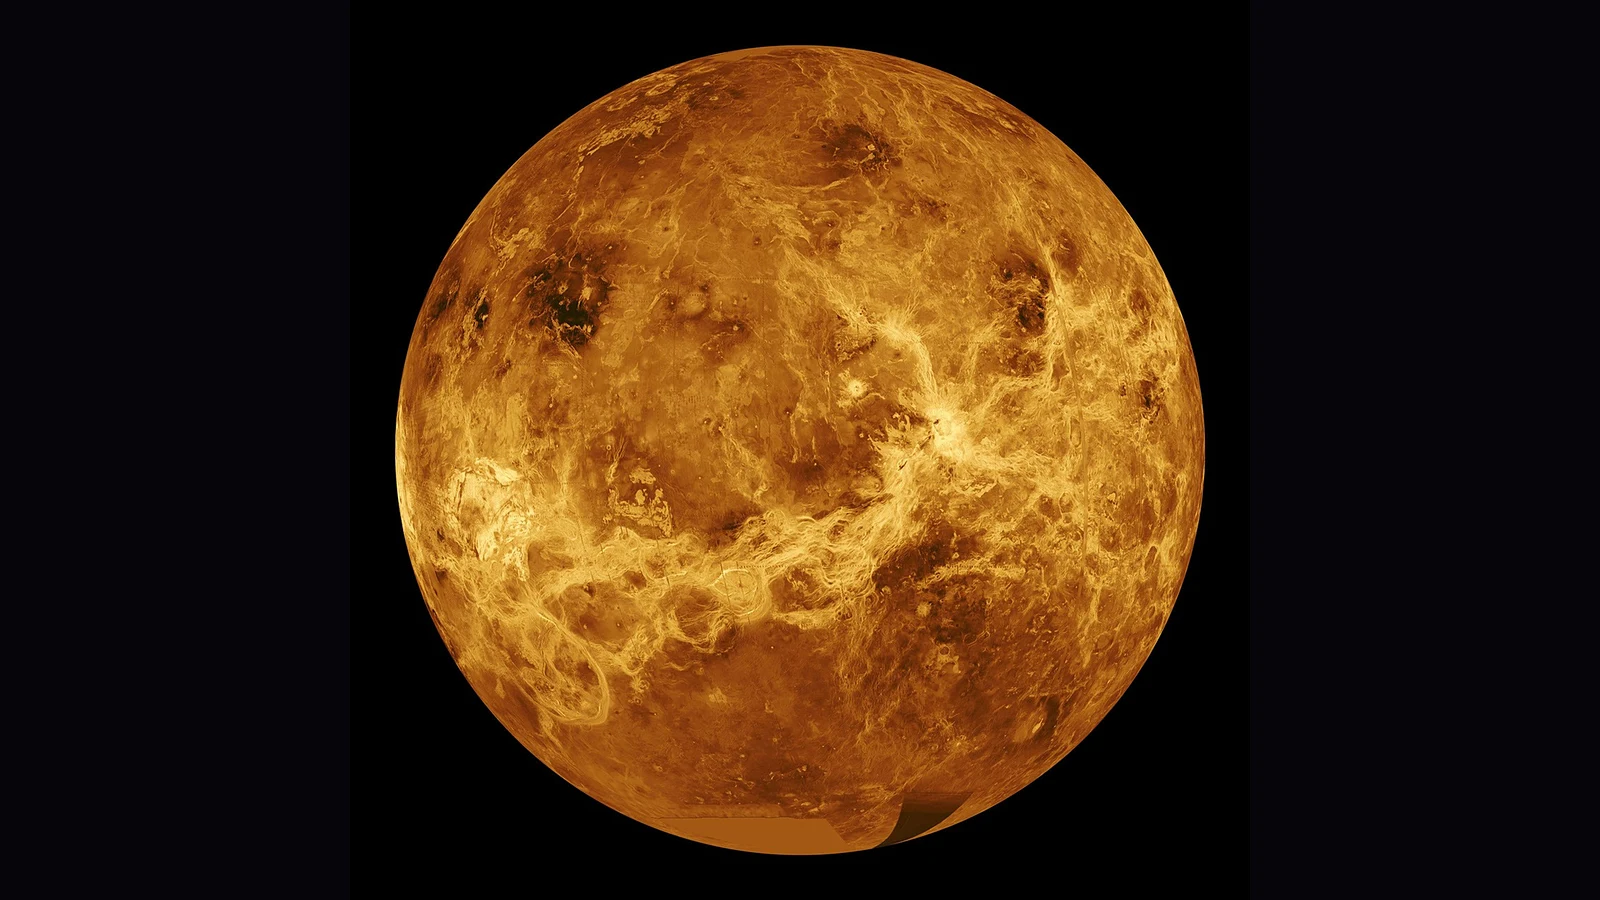
Venus needs about 243 Earth days to turn once but only about 225 to orbit the Sun. Then its backwards spin creates an even stranger sunrise clock.
World Explained · Space
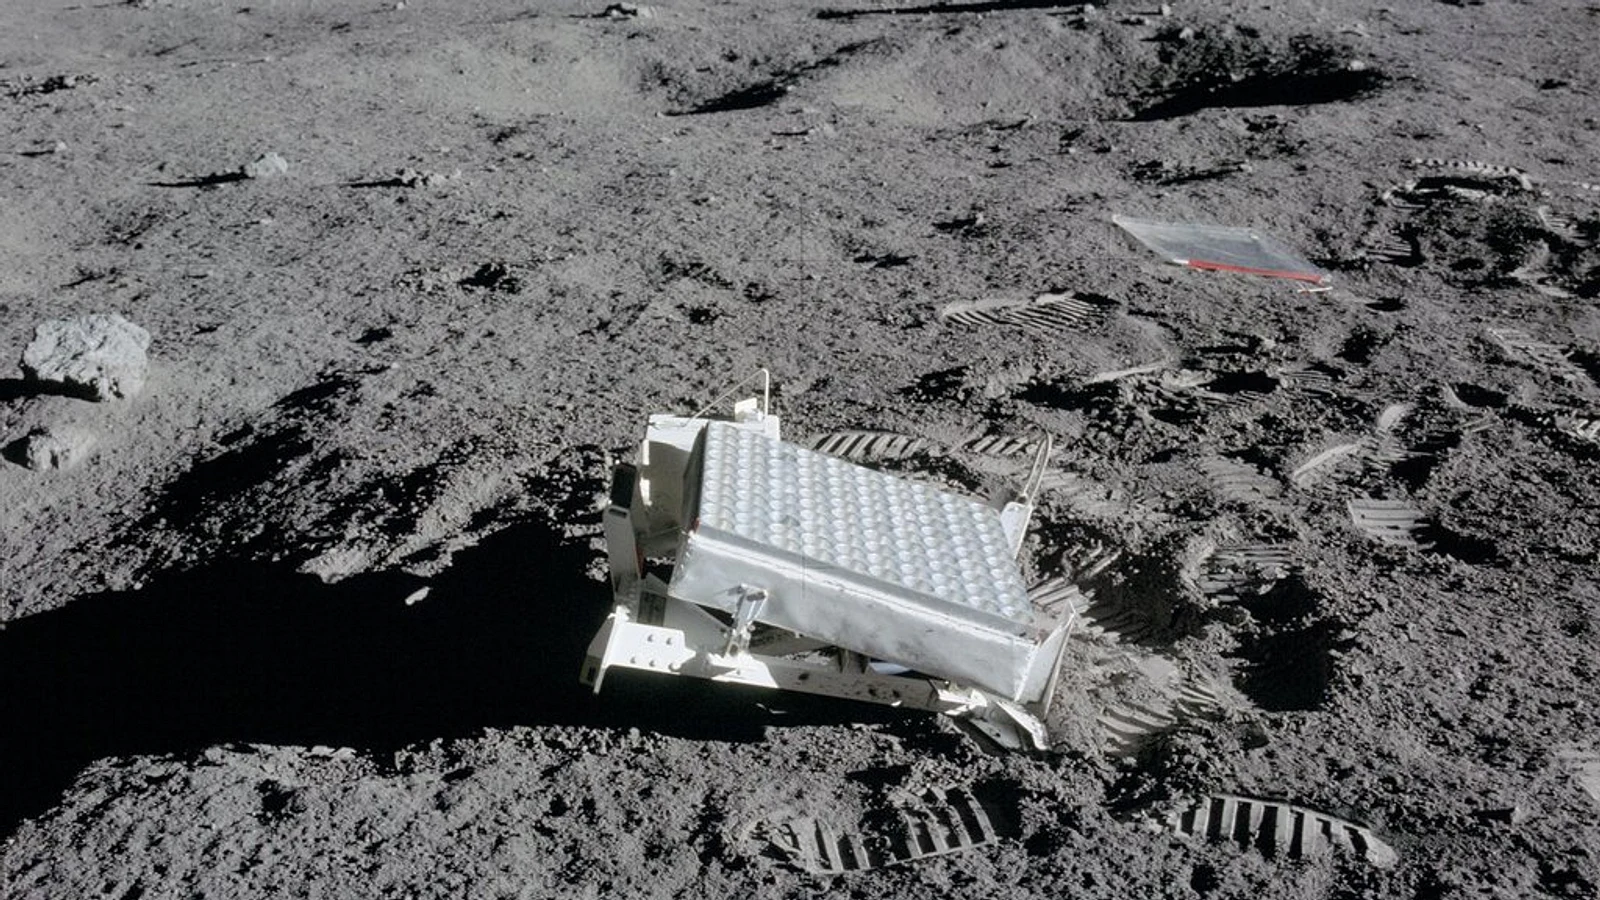
Mirrors left on the Moon reveal a change too small to see but large enough to reshape two worlds: the lunar orbit grows by about 3.8 centimetres each year.
Australian Curiosity · Night sky
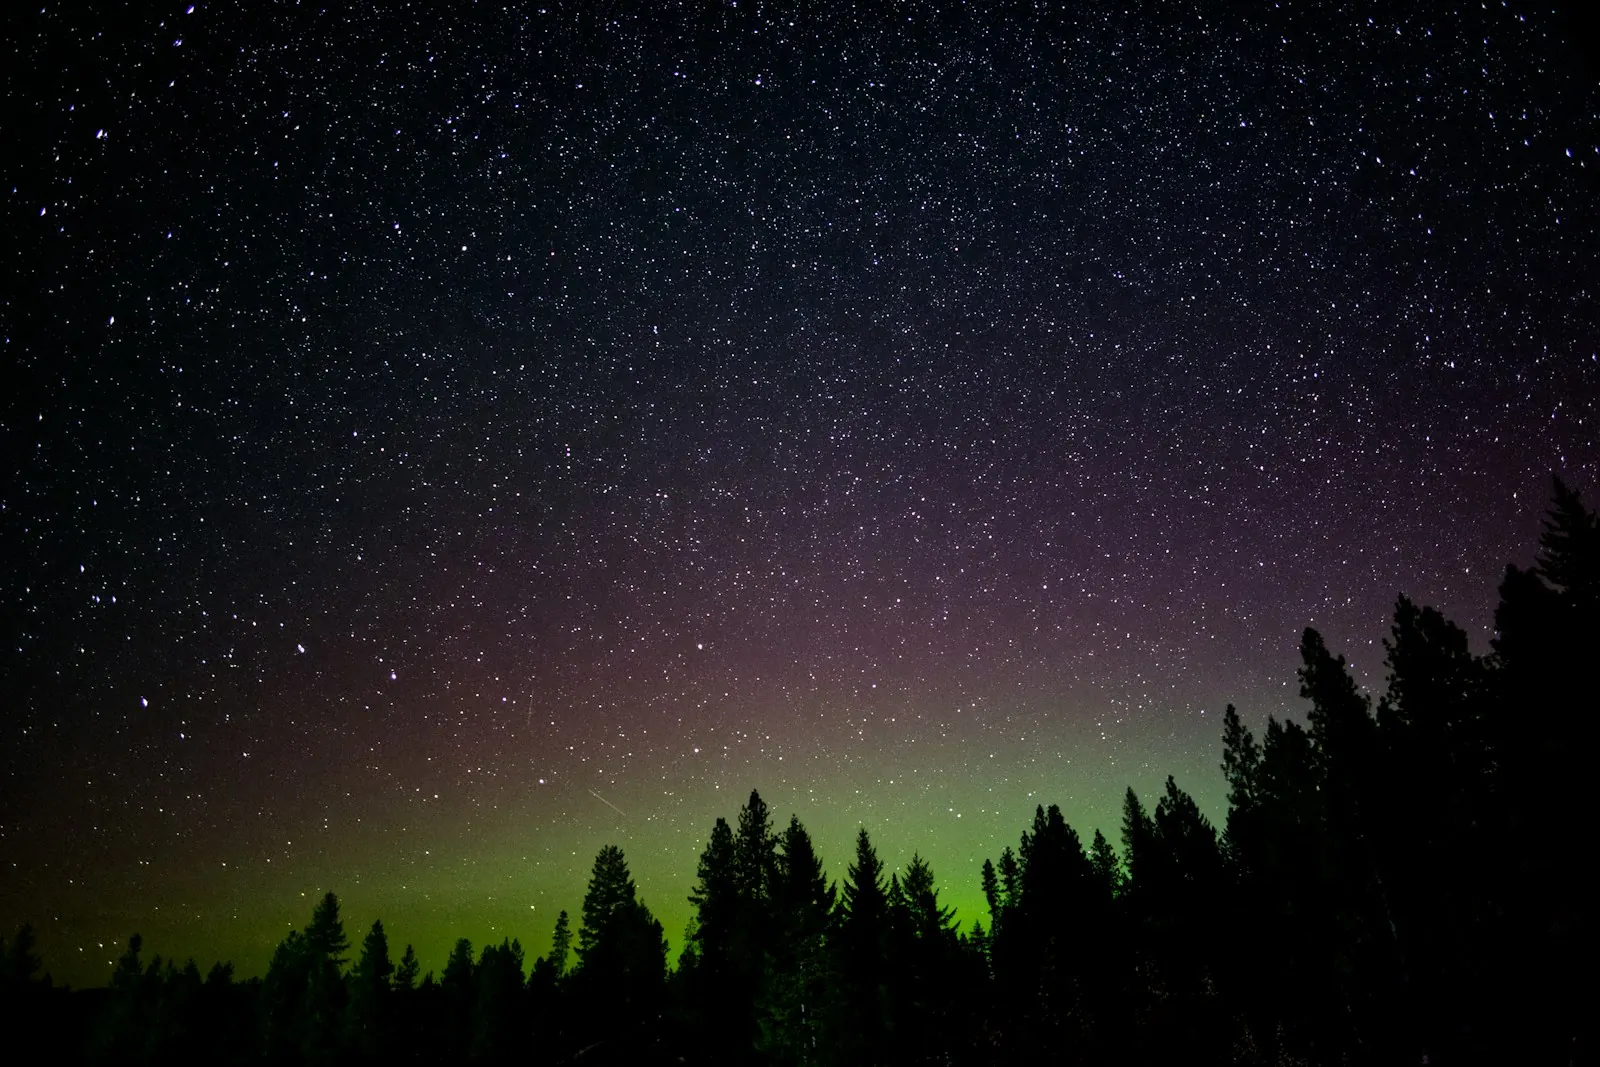
Tasmania is one of Australia's best places to look for aurora australis, but a forecast, dark southern horizon and realistic expectations matter.
World Explained · Ocean science
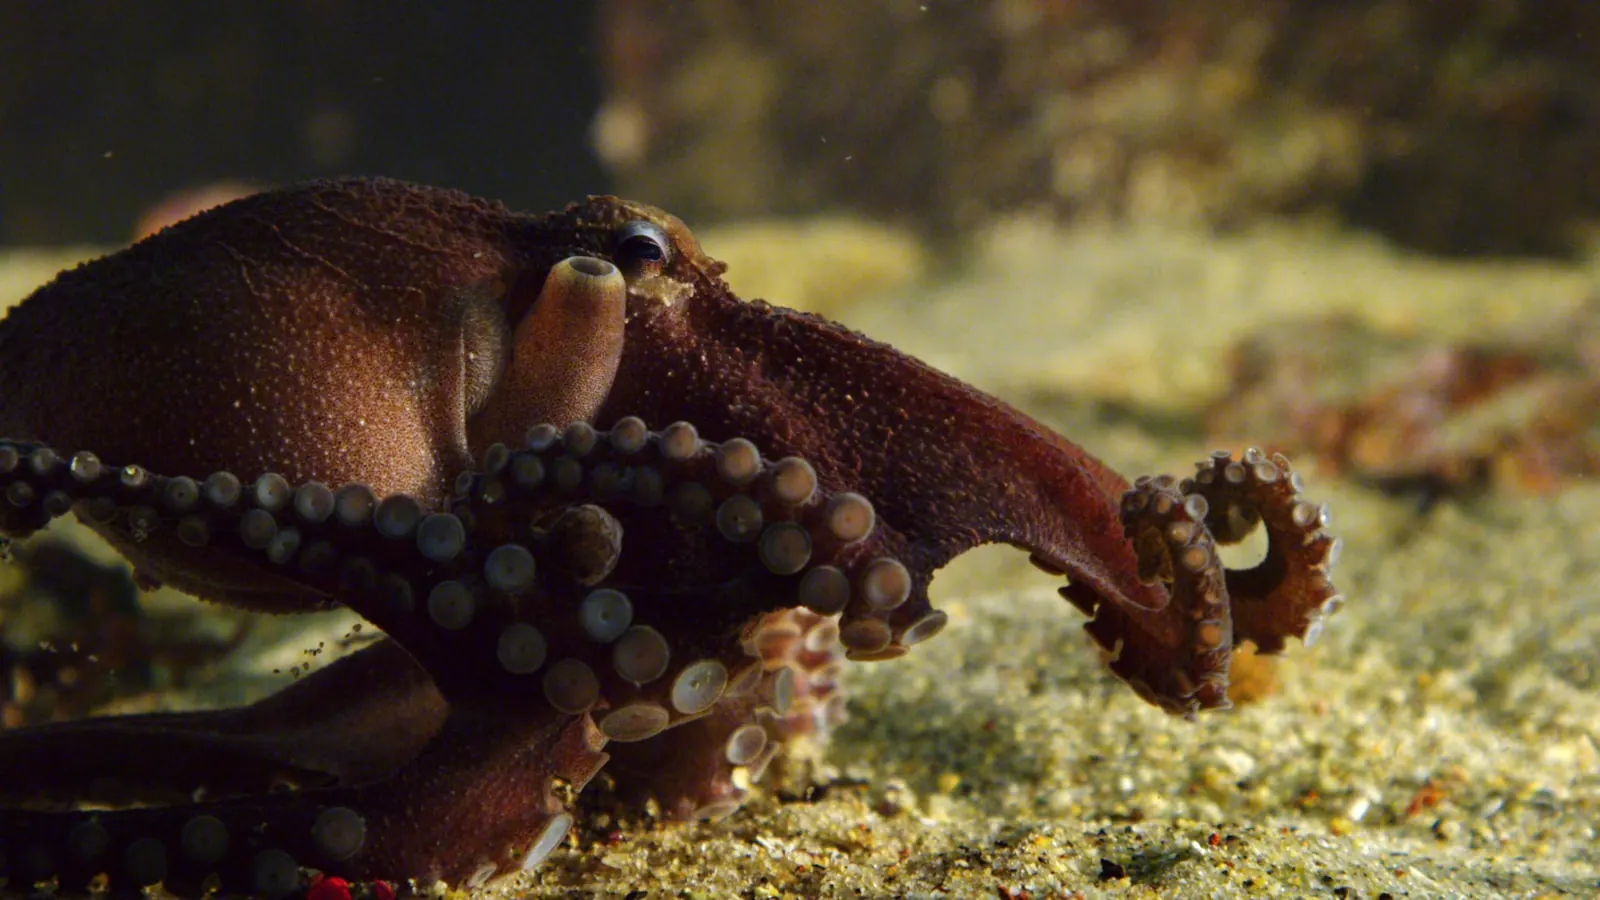
Why do octopuses have blue blood and three hearts? A source-checked explanation of hemocyanin, two gill hearts and one systemic heart.