Why a sunspot can be the visible end of the story
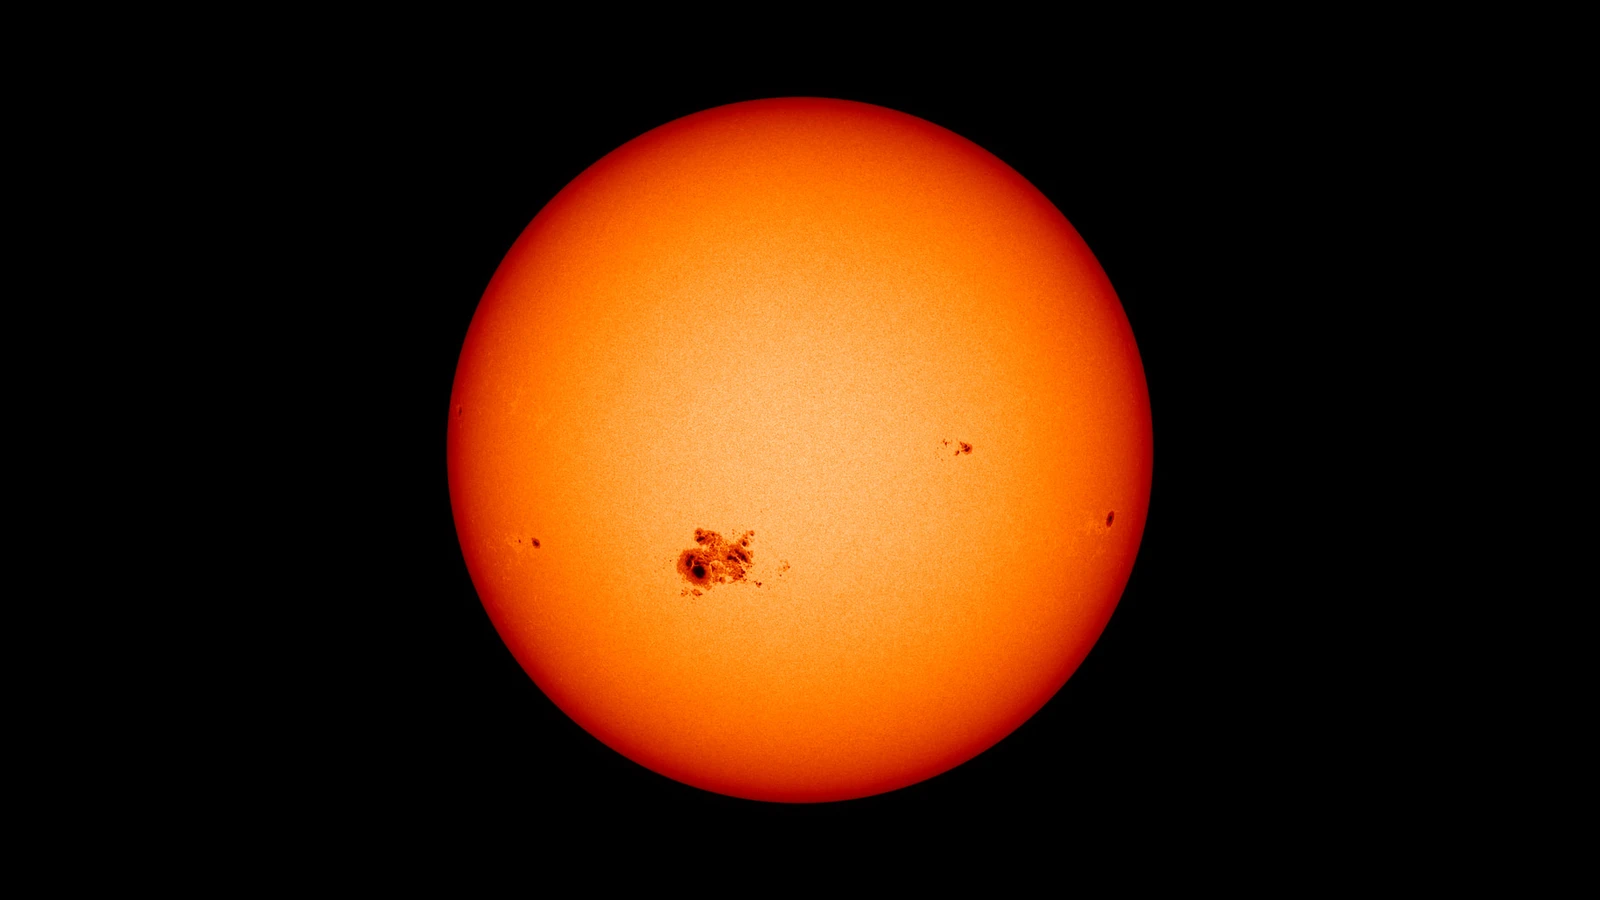
A sunspot is the part of an active region that becomes visible on the Sun's photosphere. NASA describes sunspots as cooler, darker areas created by concentrated magnetic fields, while active regions are broader areas of intense and complex magnetism that can produce flares and coronal mass ejections. That distinction matters here: the new model is not looking for a flare already underway. It is trying to detect a change associated with an active region before the surface sign becomes easy to see.
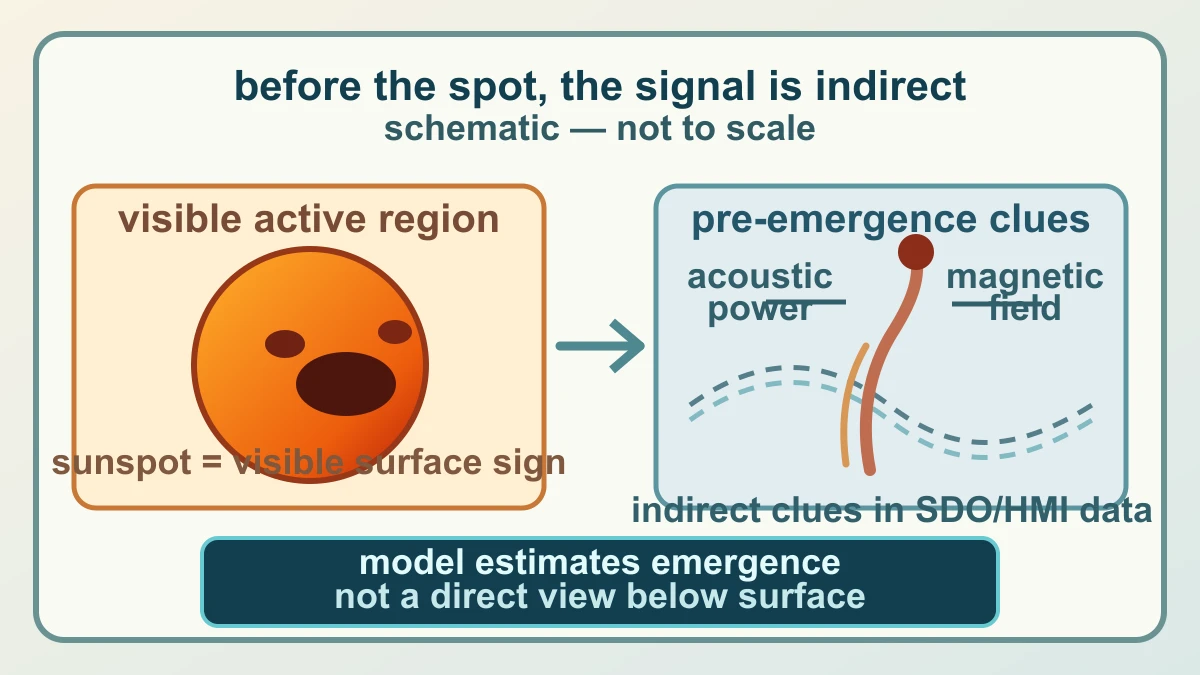
Scientists cannot simply look through the Sun and watch a magnetic structure rise from the interior. Instead, the COFFIES work uses indirect effects recorded at the surface. NASA describes small changes in acoustic power and magnetic measurements as the clues: a buried or emerging structure can alter the way the Sun's surface moves and oscillates before a recognizable sunspot appears. The signal is therefore more like a faint change in rhythm inside a noisy recording than a hidden photograph waiting to be revealed.
The measurements also have different jobs. HMI, the Helioseismic and Magnetic Imager on NASA's Solar Dynamics Observatory, provides Doppler, magnetic-field and continuum-intensity observations. Doppler measurements can be transformed into acoustic-power features, while continuum intensity supplies a visible-surface target for the forecast. A fluctuation in one stream is not automatically an emerging region; the point of the model is to learn a time pattern across streams while preserving the uncertainty around what that pattern means physically.
How the sliding-window Transformer reads solar data
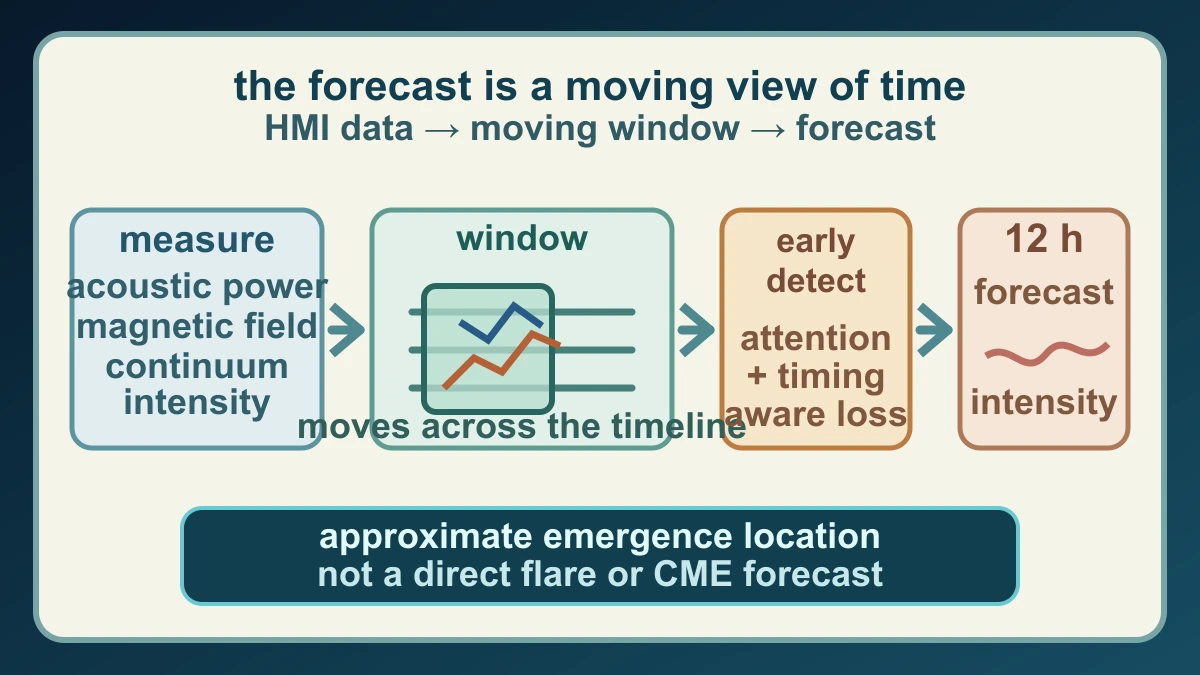
The primary study builds on the SolARED data set, which contains tracked and remapped SDO/HMI time series for large active regions and nearby areas. For the Transformer experiment, the authors report data from 46 active regions after data-quality exclusions. The inputs include acoustic-power maps in several frequency bands and line-of-sight magnetic-field information; the model forecasts how continuum intensity is likely to evolve. This is a structured record of past solar observations, not a stream of live warnings from an operational control room.
A sliding-window Transformer repeatedly examines a fixed-length slice of that longer record. Each window preserves recent measurements while the model's attention mechanism can weigh relationships across the sequence. The paper's Early Detection design adds attention biases and a timing-aware loss so the system values a faint intensity decline that appears earlier, rather than only producing a smooth average curve. The forecast reaches up to 12 hours ahead, but that horizon describes the model's prediction target—not a guaranteed 12-hour warning for every future region.
The output is a forecast of continuum-intensity evolution associated with an emerging active region, along with an approximate location in the observed solar grid. That is a narrower and more honest target than saying the model has predicted a solar storm. An active region can be associated with later eruptions, but emergence, flare production, coronal-mass-ejection launch and geoeffectiveness are different stages. The visual pipeline therefore ends at an early emergence signal and keeps the later space-weather chain outside the demonstrated result.
What the 12-hour result proves—and what it does not
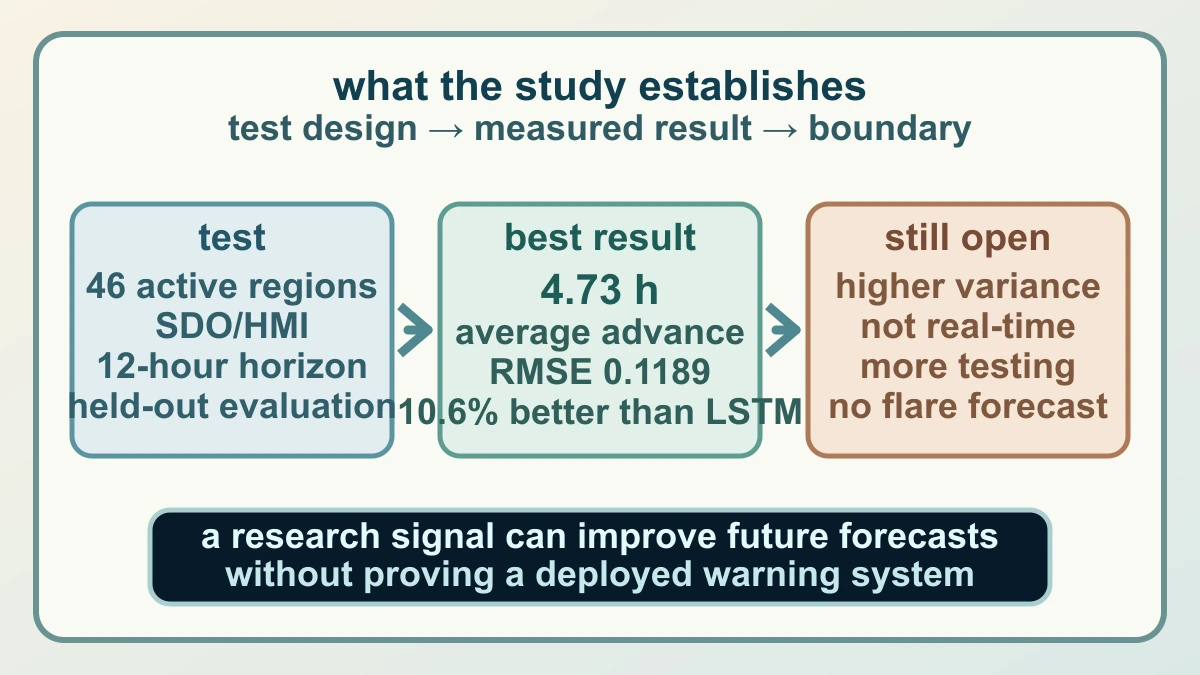
In the reported comparison, the best Early Detection Transformer without the temporal convolution front end reached an RMSE of 0.1189 and an average advance warning time of 4.73 hours under the paper's emergence criterion. The paper reports that this was a 10.6% improvement over its LSTM baseline. Those numbers show that one architecture captured an earlier and more accurate pattern on the study's evaluation data; they do not mean the model will identify every active region 4.73 hours early in the wild.
The test is also smaller and more structured than an operational deployment. The 46 regions came from a defined data set, with a fixed training and held-out evaluation arrangement, and the authors note that the more sensitive early-detection result carries greater variance. More examples, alternate splits, data-gap handling, live ingestion, false-alarm analysis and independent events would all matter before a forecaster could rely on it. A research result can be valuable precisely because it identifies a path worth testing without already being a finished service.
NASA says the approach is not ready for operational real-time forecasting, while NOAA's Space Weather Prediction Center describes operational models as tools used to understand current conditions and project future events. The COFFIES model could eventually add information about where new active regions may emerge, especially on the far side of the Sun, but this paper does not issue a flare, CME or geomagnetic-storm warning. The established claim is an earlier research signal; the operational promise remains a question for future validation.
Sources and further reading
- JGR primary article, open arXiv record: Forecasting Continuum Intensity for Solar Active Region Emergence Prediction Using Transformers ↗
- NASA Science: NASA's COFFIES Uses AI to Predict Storm-Causing Active Regions on Sun ↗
- NASA COFFIES DRIVE Science Center ↗
- Primary dataset paper: SolARED Solar Active Region Emergence Dataset ↗
- NASA Solar Dynamics Observatory Data Access ↗
- NASA Science: Sunspots ↗
- NOAA Space Weather Prediction Center: Models ↗
- NASA Images and Media Usage Guidelines ↗
This article was written for Curiosity Desk. We do not copy other publishers or invent quotes. If a material error is found, we correct it openly.
Read the full standards →One answer should lead to a better question
Bring your curiosity to the group
Curious Minds is our public Facebook community for surprising science, strange history, Australian wildlife and everyday questions. No copied posts, no personal-friend invitations and no link dumping.
- Three self-contained discussion prompts each week
- Sourced answers and honest uncertainty
- Respectful conversation without spam