Why the decagon appeared only when Saturn came back into view
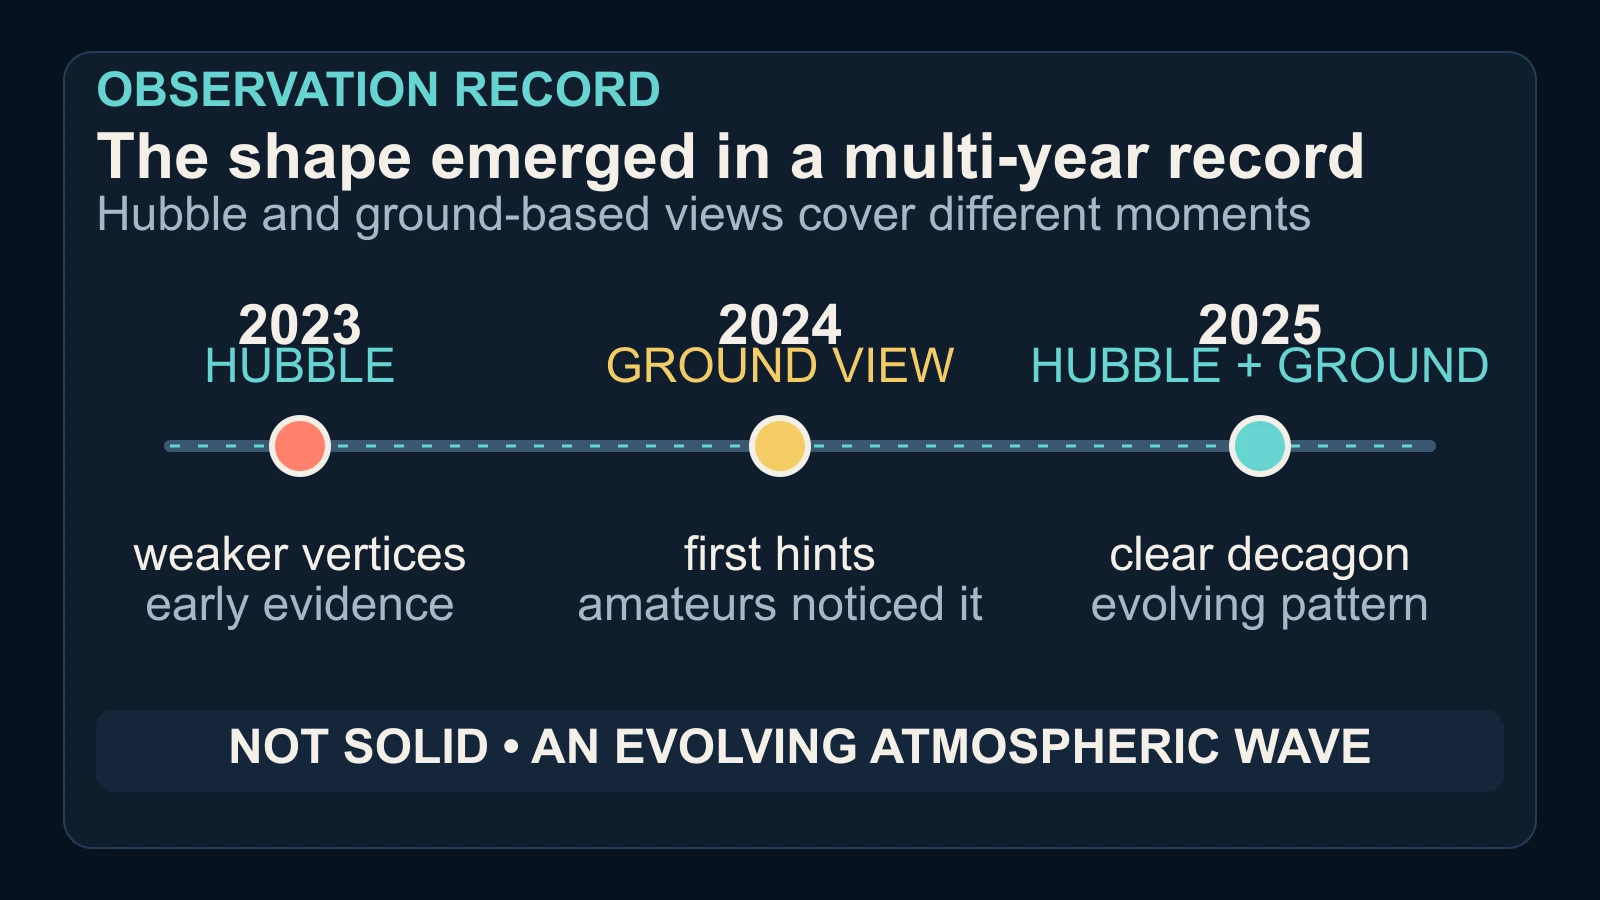
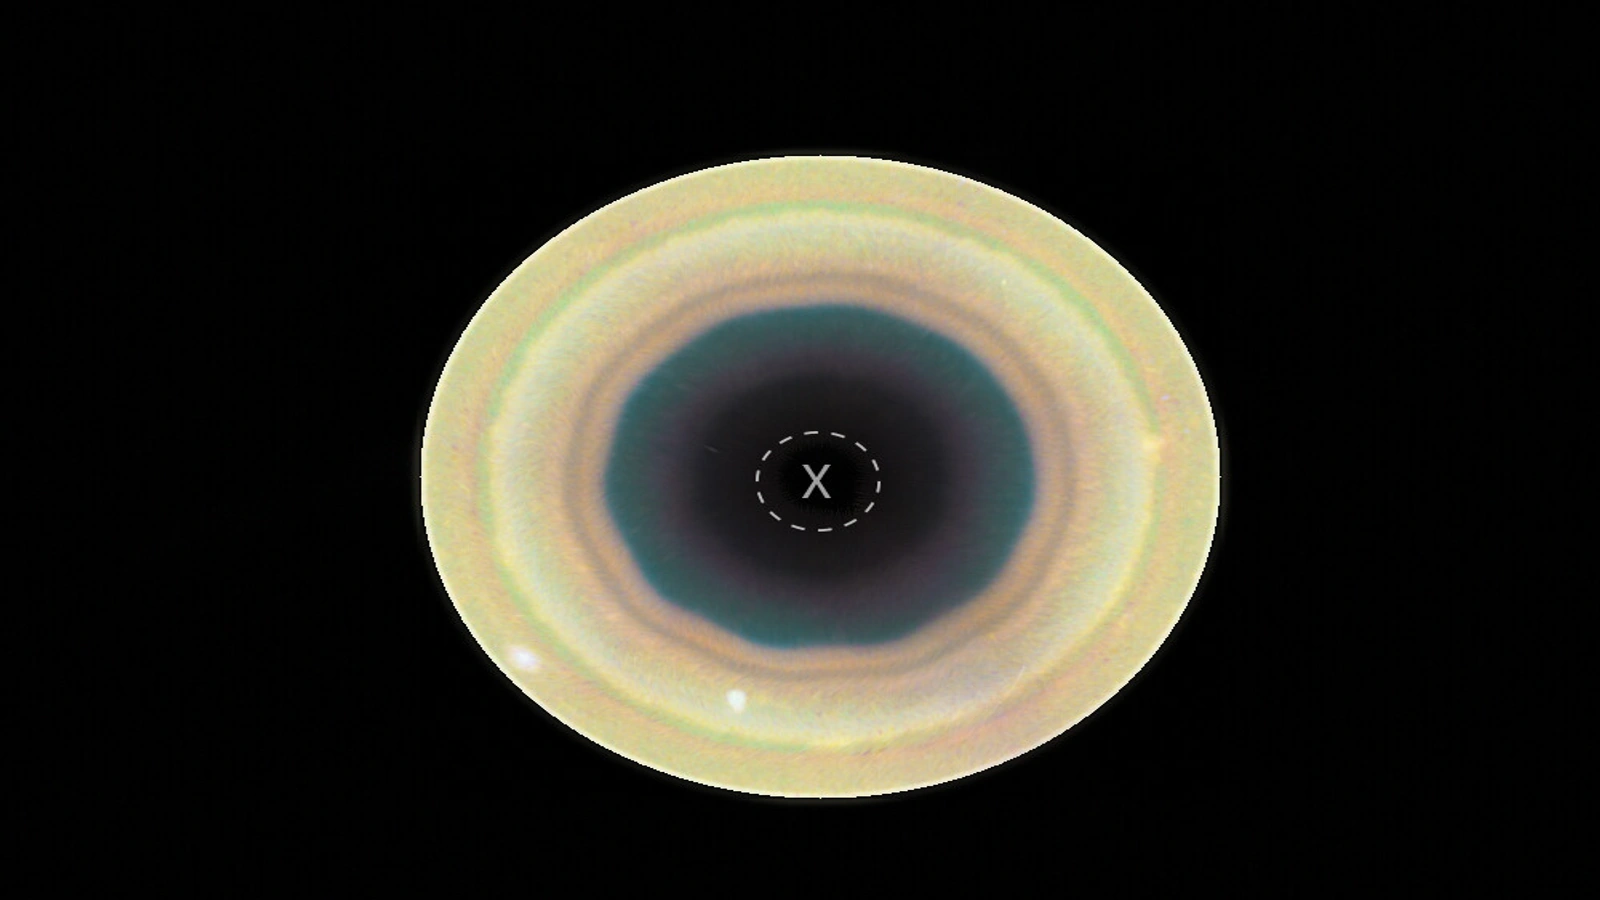
The headline observation is not a before-and-after claim that a solid object appeared. Hubble images from 2023 showed weaker vertices around Saturn’s south pole; ground-based observers noticed hints in 2024; by 2025, additional ground images and Hubble views made the ten-sided pattern clear. The record matters because several dates show the feature changing, which makes an atmospheric wave more plausible than a fixed mark in one image.
Saturn’s seasons also shape what observers can see. The planet takes about 29 Earth years to circle the Sun, so a polar region can spend long stretches at a poor angle or in seasonal darkness. This does not mean the south-pole wave began when Hubble noticed it. It means the new record combines useful viewing geometry, repeated Hubble monitoring and ground observations to trace a feature that Cassini’s 2004–2017 record did not reveal as a long-lived southern formation.
That distinction is the first answer to “how did it form?”: the observations do not show an instantaneous birth. They show a pattern that was faint in earlier frames, more apparent later, and now needs continued monitoring. The NASA and ESA accounts call it evolving and say additional Hubble and Webb observations, together with modelling, are needed to establish its lifetime. A photograph can reveal the shape; a time series is what turns it into a physical question.
A slow-moving pattern inside a much faster jet
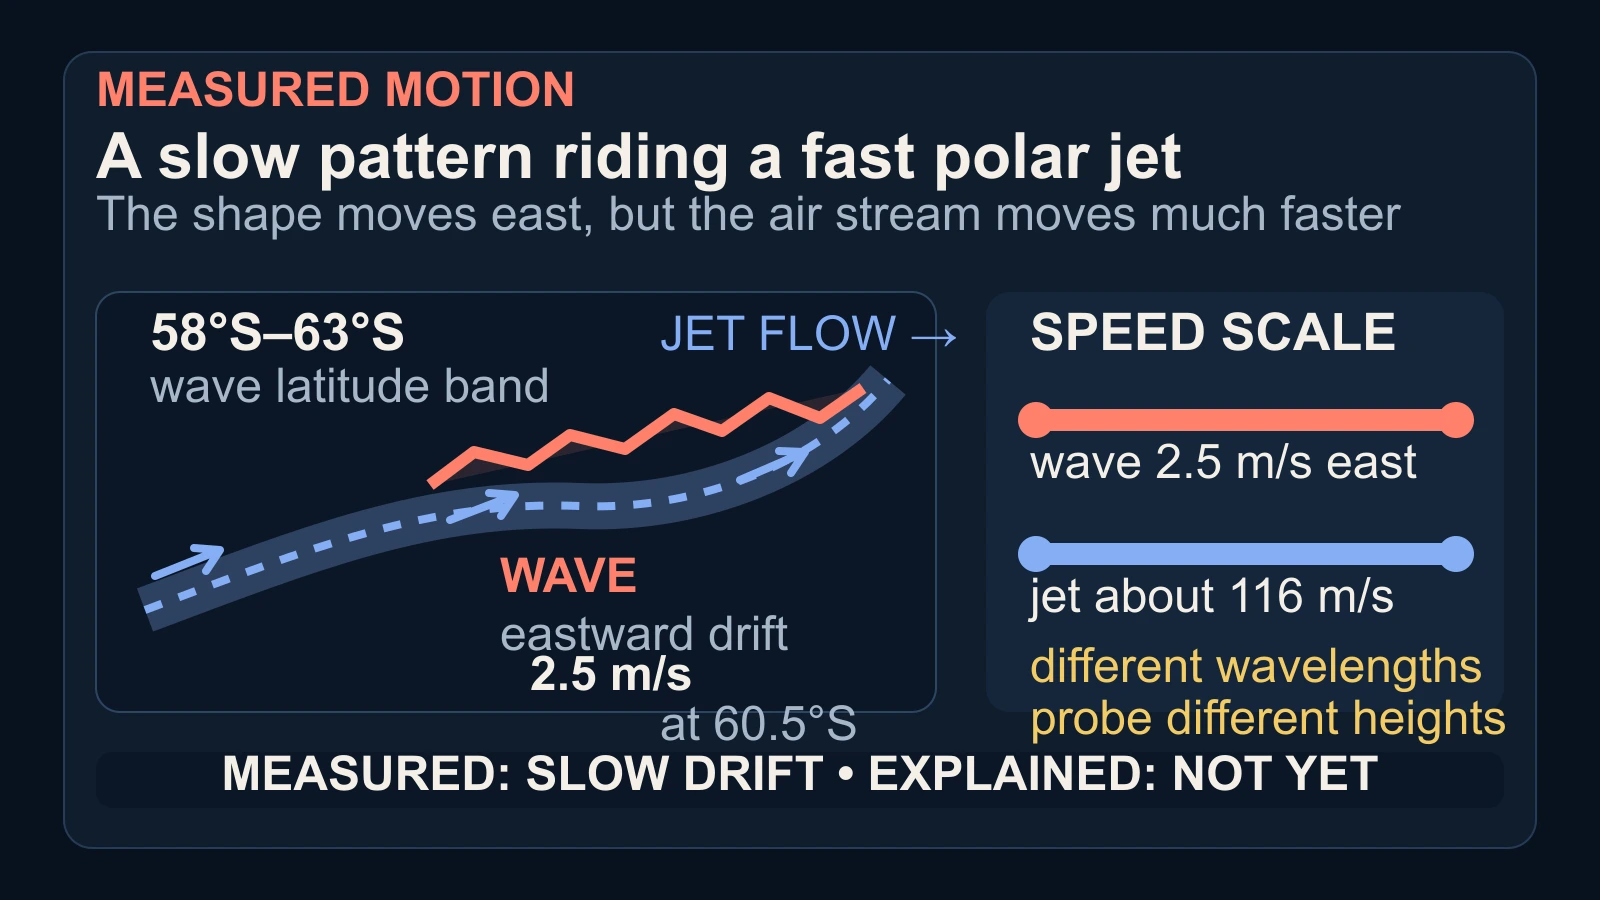
The paper places the decagon at planetographic latitudes of about 58°S to 63°S. It moves eastward at 2.5 metres per second, while the zonal jet near 60.5°S travels at about 116 metres per second. Those are not competing descriptions: the first is the motion of a visible wave pattern, while the second describes the much faster atmospheric flow carrying and shaping the environment around it. A ripple can move differently from the water beneath it.
NASA’s report says the wave extends through multiple atmospheric layers, and the Hubble observations use different wavelengths to probe different altitudes. That makes the feature more than a painted outline on one cloud deck. The changing colour and contrast with wavelength give researchers vertical clues, while the latitude range gives a meridional boundary. Together, the observations constrain where the pattern lives without supplying a complete three-dimensional map of Saturn’s atmosphere.
The leading explanation is therefore a dynamical one: the paper describes a large-scale meandering wave that could be trapped vertically and confined meridionally by the curvature of the dominant jet. Shallow-water simulations suggest it might begin with a spatially periodic disturbance in the jet peak or be driven by a dark anticyclonic vortex immediately to the north. But a simulation is not a direct observation. The speed contrast narrows the possibilities; it does not select the cause.
What the images show—and what they cannot yet explain
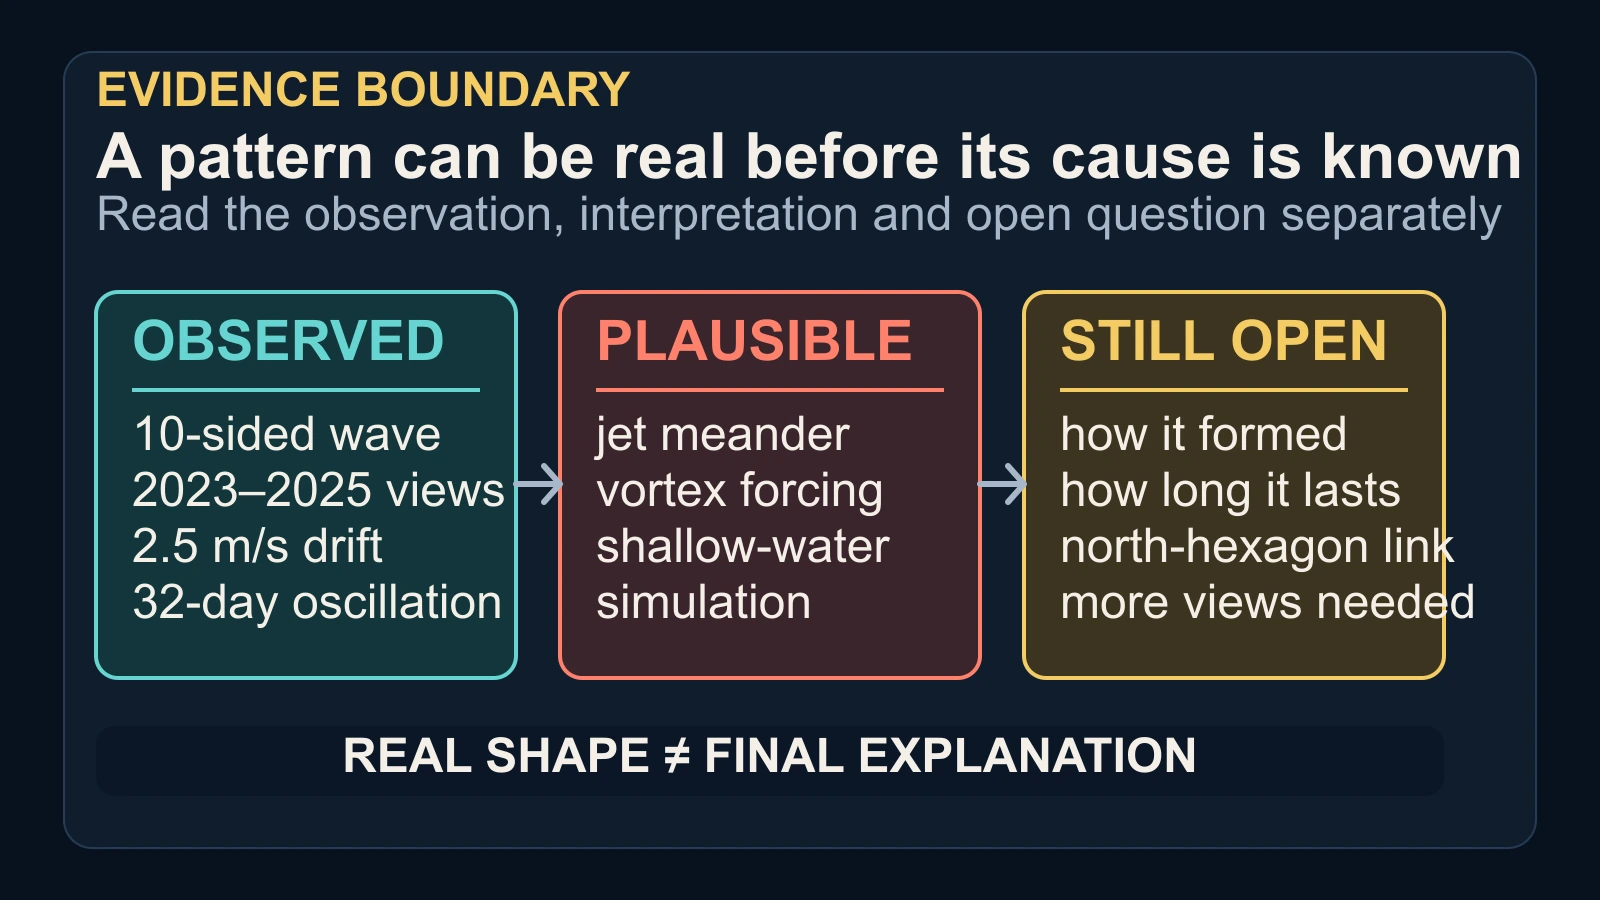
The pattern is described quantitatively, not only by eye. The paper reports that the vertices oscillate in longitude with a period of about 32 days and amplitudes ranging from roughly 4.6° to 8.4°. Hubble and ground-based observations also show weaker vertices in earlier years and stronger, more legible structure later. A multi-year change record is useful evidence that the shape is an evolving atmospheric phenomenon rather than a processing artefact in one spectacular frame.
The northern hexagon is an important comparison but not a verdict. NASA describes that older feature as a long-lived, wavy jet stream about 20,000 miles across, with winds near 200 miles per hour and a record stretching across decades. The new southern observation is not yet proved to be a permanent twin, a solid geometric boundary or the same process in reverse. Even the northern jet’s exact control remains an open scientific question.
What remains open is the part a headline cannot honestly settle: how the southern wave formed, how long it will survive, why its geometry is so regular and whether it relates to the northern hexagon beyond sharing a broad jet-stream setting. Further Hubble and Webb views plus atmospheric modelling can test those possibilities. For now, the best-supported answer is an evolving wave embedded in a polar jet; its measured motion is real, while its origin is still a hypothesis.
Sources and further reading
- NASA Science — NASA’s Hubble Tracks New Decagon Encircling Saturn’s South Pole ↗
- Crossref record — A decagon wave around Saturn’s south pole ↗
- ESA/Hubble — Hubble tracks new decagon encircling Saturn’s south pole ↗
- ESA/Hubble — Decagon on Saturn’s south pole (colour image) ↗
- ESA/Hubble — Decagon on Saturn’s south pole (single filter image) ↗
- NASA — NASA’s Cassini Spacecraft Obtains Best Views of Saturn Hexagon ↗
- NASA Science — Spring Reveals Saturn’s Hexagon Jet Stream ↗
- ESA/Hubble — Usage of images, videos and web texts ↗
This article was written for Curiosity Desk. We do not copy other publishers or invent quotes. If a material error is found, we correct it openly.
Read the full standards →One answer should lead to a better question
Bring your curiosity to the group
Curious Minds is our public Facebook community for surprising science, strange history, Australian wildlife and everyday questions. No copied posts, no personal-friend invitations and no link dumping.
- Three self-contained discussion prompts each week
- Sourced answers and honest uncertainty
- Respectful conversation without spam