A sudden brightening is the first signal
An outburst is first a comparison, not a diagnosis. Astronomers ask whether the comet became measurably brighter than its recent or expected state, then attach the comparison to a date, observing band, geometry and calibration. That distinction matters because a bright photograph can reflect exposure and processing as well as the object itself. A defensible outburst claim starts with records that can be compared, not with a colourful appearance that invites a story.
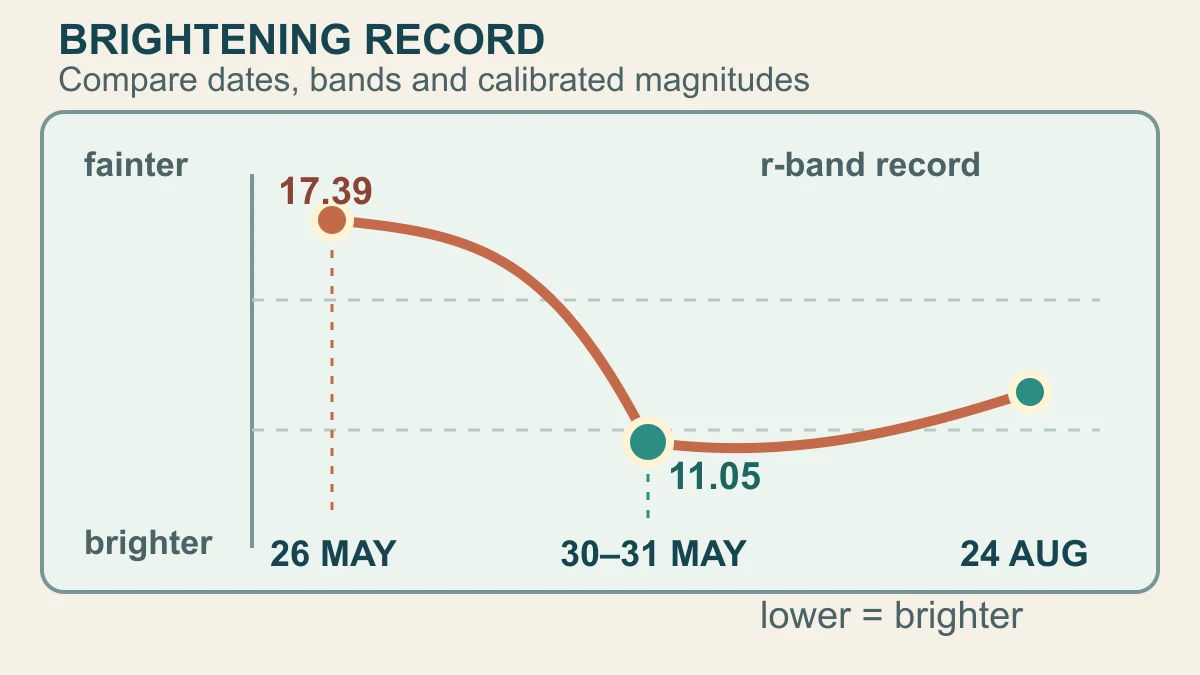
For Comet 220P/McNaught, ATel #17829 reported an r-band measurement near magnitude 17.39 on 26 May and about 11.05 on 31 May, with the onset placed between 30 and 31 May. The numbers are an enormous apparent change on the astronomical magnitude scale, whose smaller values mean greater brightness. They still describe light received by an observer under stated conditions, not the total energy released inside the nucleus. The same circular also reported ejecta and follow-up observations, giving the brightness jump a physical-looking context that could be checked rather than merely admired.
NASA's 24 August APOD describes two surprising 2026 outbursts and a roughly 20,000-fold increase in apparent brightness, while the archived APOD and current NASA route say the cause is unknown. Those figures should not be casually collapsed into one calculation: different reference points, bands, dates, apertures and observing geometries can change the comparison. The useful lesson is methodological. Repeat the measurement with its context, compare independent records and use the image to ask which surrounding features need explanation—not to supply the explanation by itself.
How images, brightness and tails become evidence
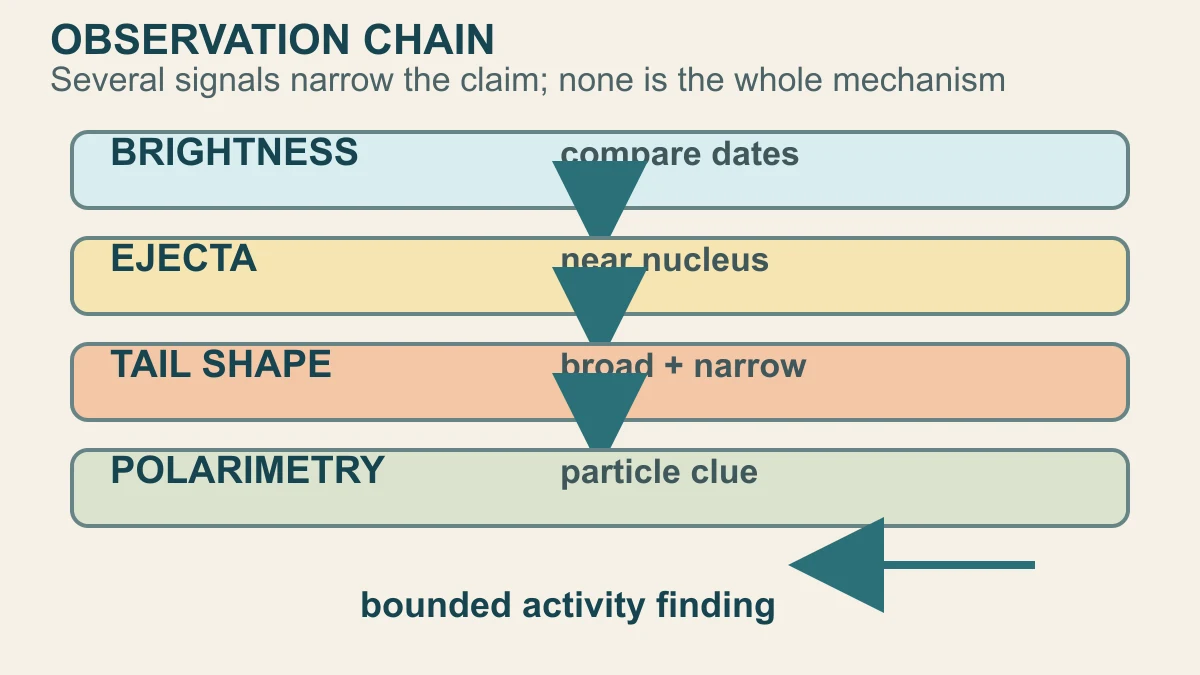
Photometry turns a sequence of observations into a brightness record. Observers measure the light in a defined aperture or image region, note the filter and time, and compare the result with earlier measurements or a normal trend. The result becomes stronger when more than one observing route sees the change. ATel #17829 records ZTF and ATLAS follow-up around the discovery, while later reports add measurements that help show whether the activity faded, returned or changed character.
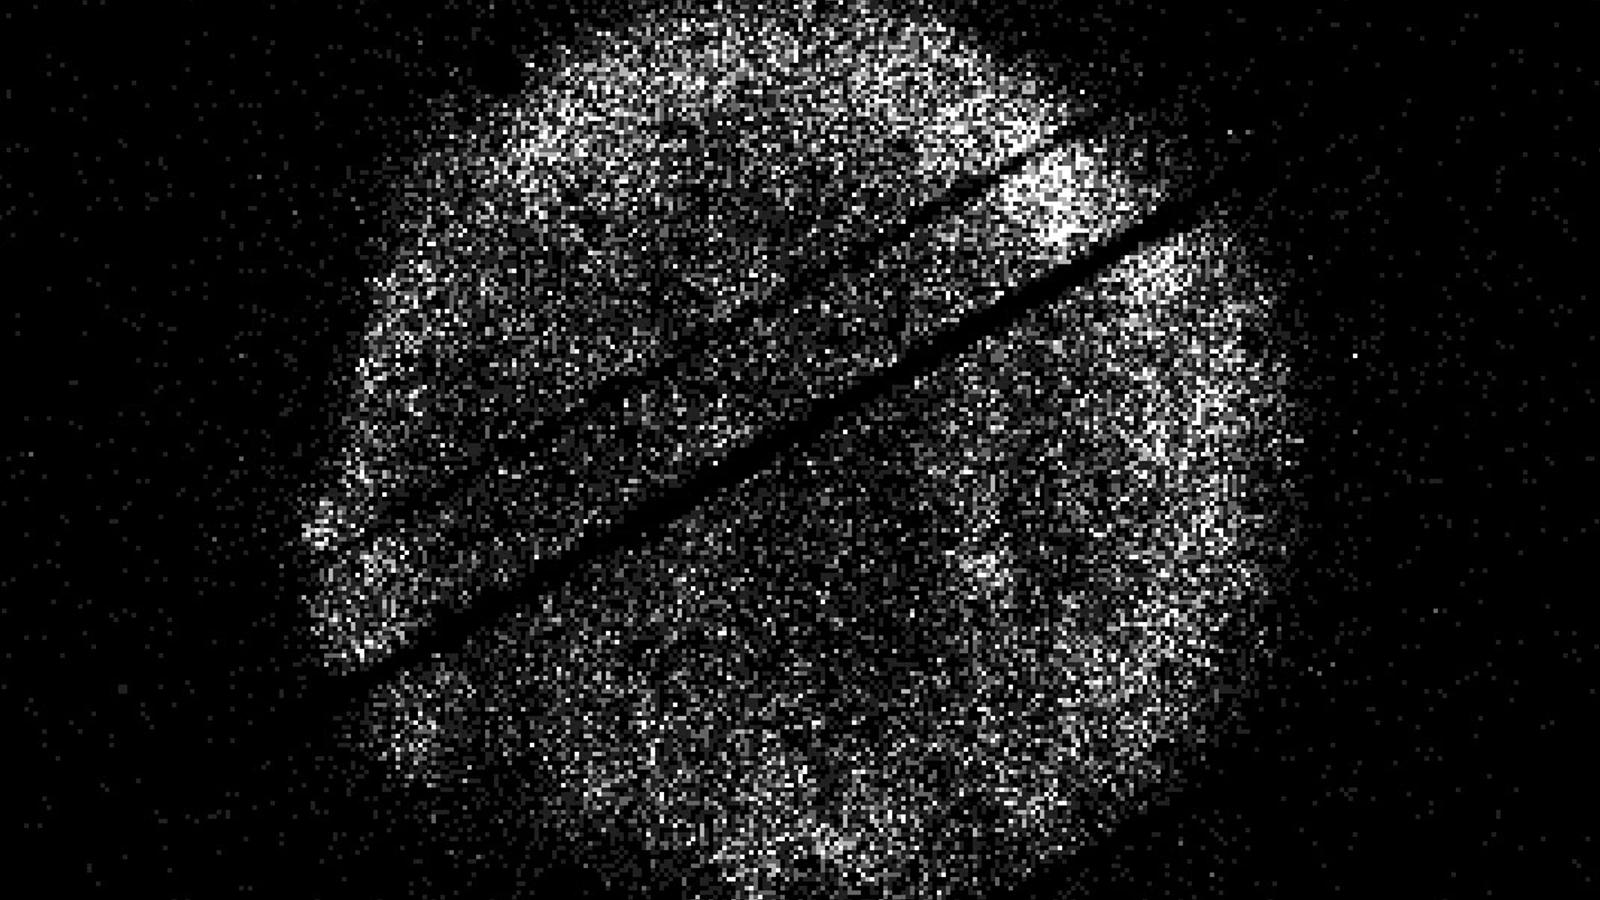
Morphology supplies a second kind of evidence. A comet's coma is the diffuse material around the nucleus; ejecta can appear as a temporary extension or structure, and tails can separate into shapes that change with time and viewing geometry. The 220P reports describe a broad diffuse tail and a narrower linear feature in later observations. Those forms establish what the surrounding material looked like. They do not automatically identify every particle, prove a gas-production rate or reveal which event inside the nucleus launched it.
The chain can be extended with colour, polarimetry and spectroscopy. ATel #17956 reports magnitude and colour follow-up, while ATel #17984 describes g, r and i polarimetry and morphology, with a dust-dominated interpretation of the observed material and a call for additional spectra. Polarization can constrain how light scatters from particles; spectra can test for particular emissions; neither is a magic label. The strength comes from aligning several records and preserving their uncertainty, so the conclusion remains an activity finding rather than a complete interior model.
What the observations do not reveal by themselves
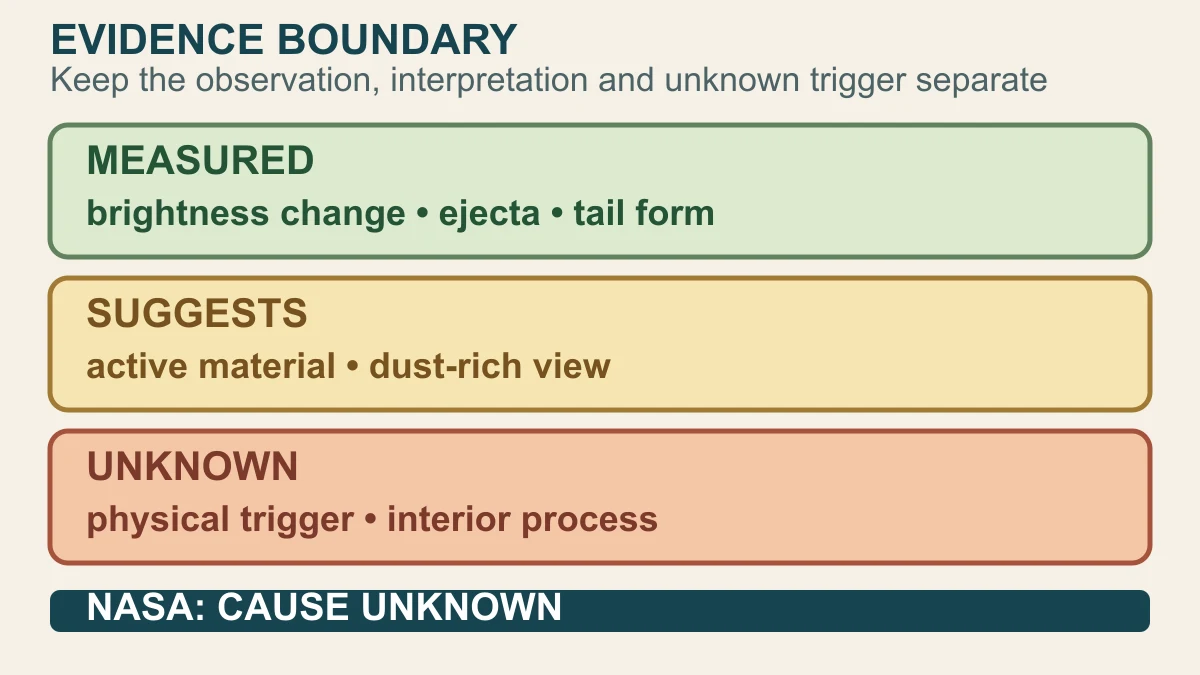
The established part of the 220P story is already substantial: observers recorded a large apparent brightening, an onset window, ejecta, a changing coma or tail and later colour and polarization measurements. NASA's object route and the JPL Small-Body Database provide the identity and orbital context needed to keep those reports attached to the right periodic comet. Together, the records support calling the event an outburst and describing how its visible surroundings changed.
The next layer is conditional. The combination of brightness, ejecta, tail structure and scattering behaviour suggests that material was released and redistributed around the nucleus, and the follow-up can test whether dust or gas contributes to a feature. But suggests is not proves. A tail's direction depends on viewing geometry and particle dynamics; a green coma is not by itself a chemical inventory; and a brightness increase is not a direct measurement of the trigger or of the nucleus's internal pressure.
The physical cause therefore remains open. NASA mentions possibilities such as subsurface gas release or cometary quakes, but presents them as possibilities rather than a result. A stronger explanation would need time-resolved photometry, calibrated morphology, spectra, polarization, the observing geometry and a model that survives comparison with all of them. The honest answer is narrower and more useful: Comet 220P's outburst is established by converging observations, while the event that started it—and the full story inside the nucleus—still has to be tested.
Sources and further reading
- NASA Science APOD — Comet 220P in Outburst ↗
- NASA APOD archive — 2026 August 24 Comet 220P in Outburst ↗
- NASA/JPL Small-Body Database API — 220P ↗
- ATel #17829 — Large Apparent Outburst of Comet 220P/McNaught ↗
- ATel #17956 — Magnitudes and colors of comet 220P/McNaught during outburst ↗
- ATel #17984 — Post-outburst morphology and polarization behavior of 220P/McNaught ↗
- FG-Kometen — 220P/McNaught 2026 observation analysis ↗
This article was written for Curiosity Desk. We do not copy other publishers or invent quotes. If a material error is found, we correct it openly.
Read the full standards →One answer should lead to a better question
Bring your curiosity to the group
Curious Minds is our public Facebook community for surprising science, strange history, Australian wildlife and everyday questions. No copied posts, no personal-friend invitations and no link dumping.
- Three self-contained discussion prompts each week
- Sourced answers and honest uncertainty
- Respectful conversation without spam