One transit carries two signals
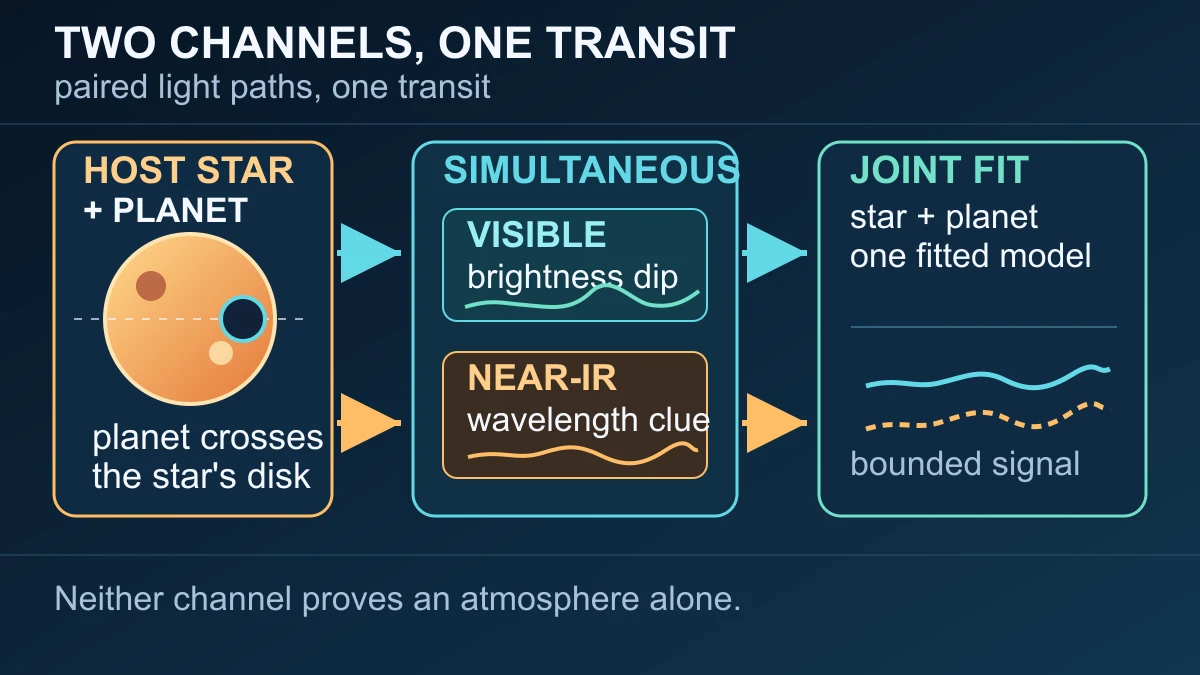
Pandora separates the signals statistically, not with a physical shutter. During a planet's transit, it watches the host star in visible light while collecting a near-infrared spectrum at the same time. The planet blocks a small part of the star, and light that passes through the planet's atmosphere can lose particular wavelengths. Meanwhile, the star itself can change the baseline through cool spots or bright faculae. The paired measurements give the model evidence about both sources of variation.
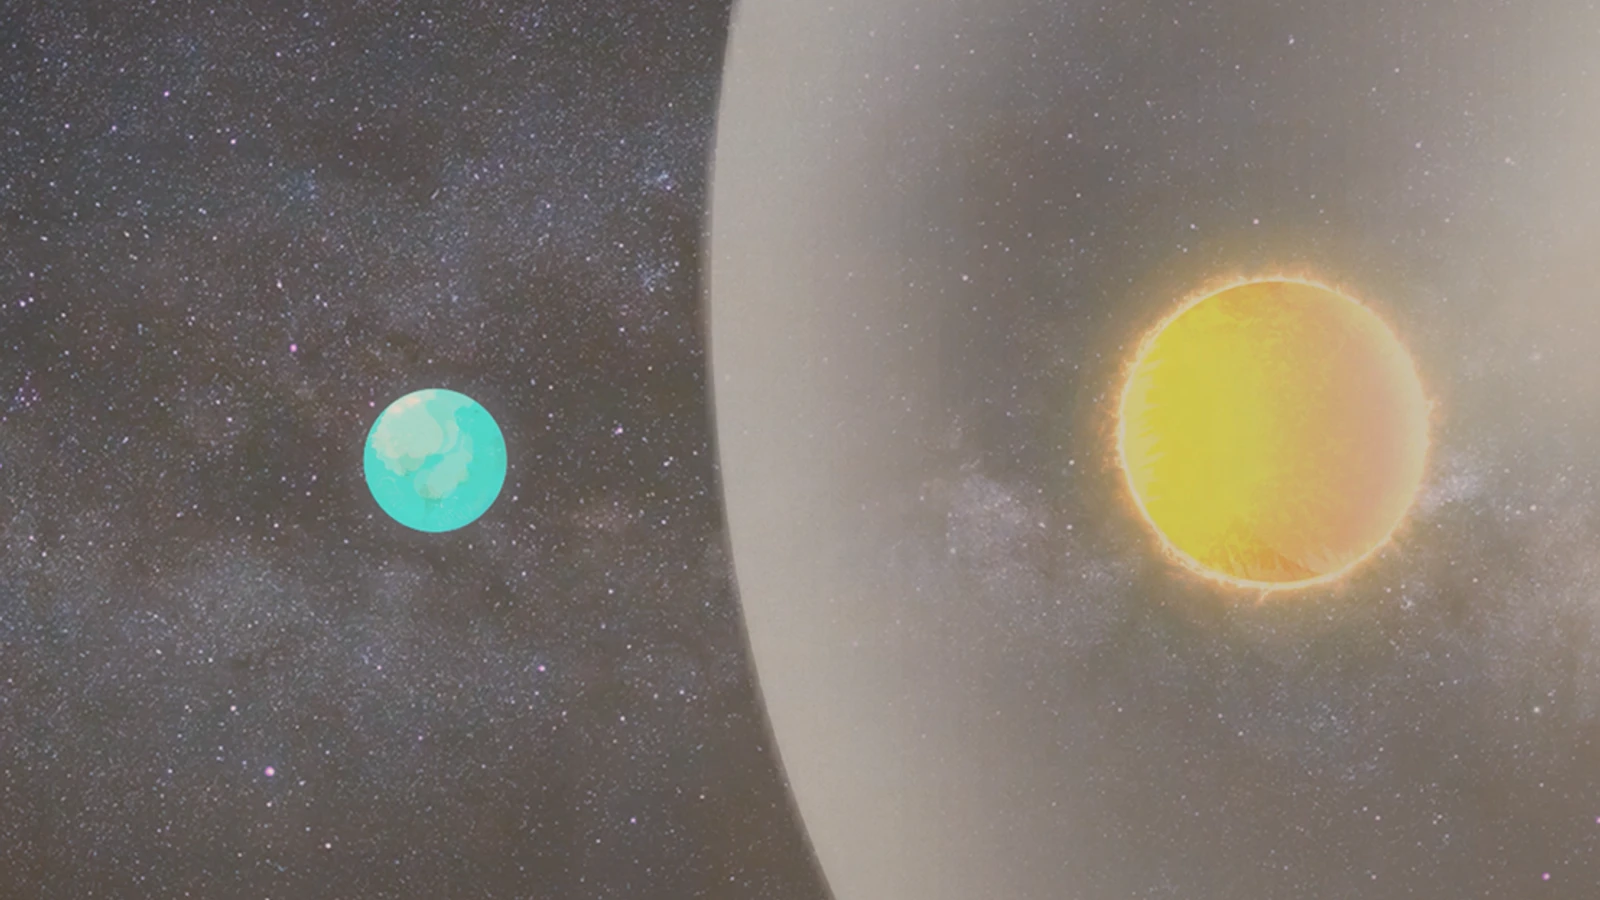
The geometry is simple but the inference is not. Astronomers compare the star's light outside transit with the smaller, wavelength-dependent signal during transit. If a molecule in the planet's atmosphere absorbs some infrared wavelengths, the apparent transit depth can change with wavelength. But the spectrum is measured against the light of an imperfectly uniform star, so a stellar patch can imitate, hide or reshape a feature that appears planetary.
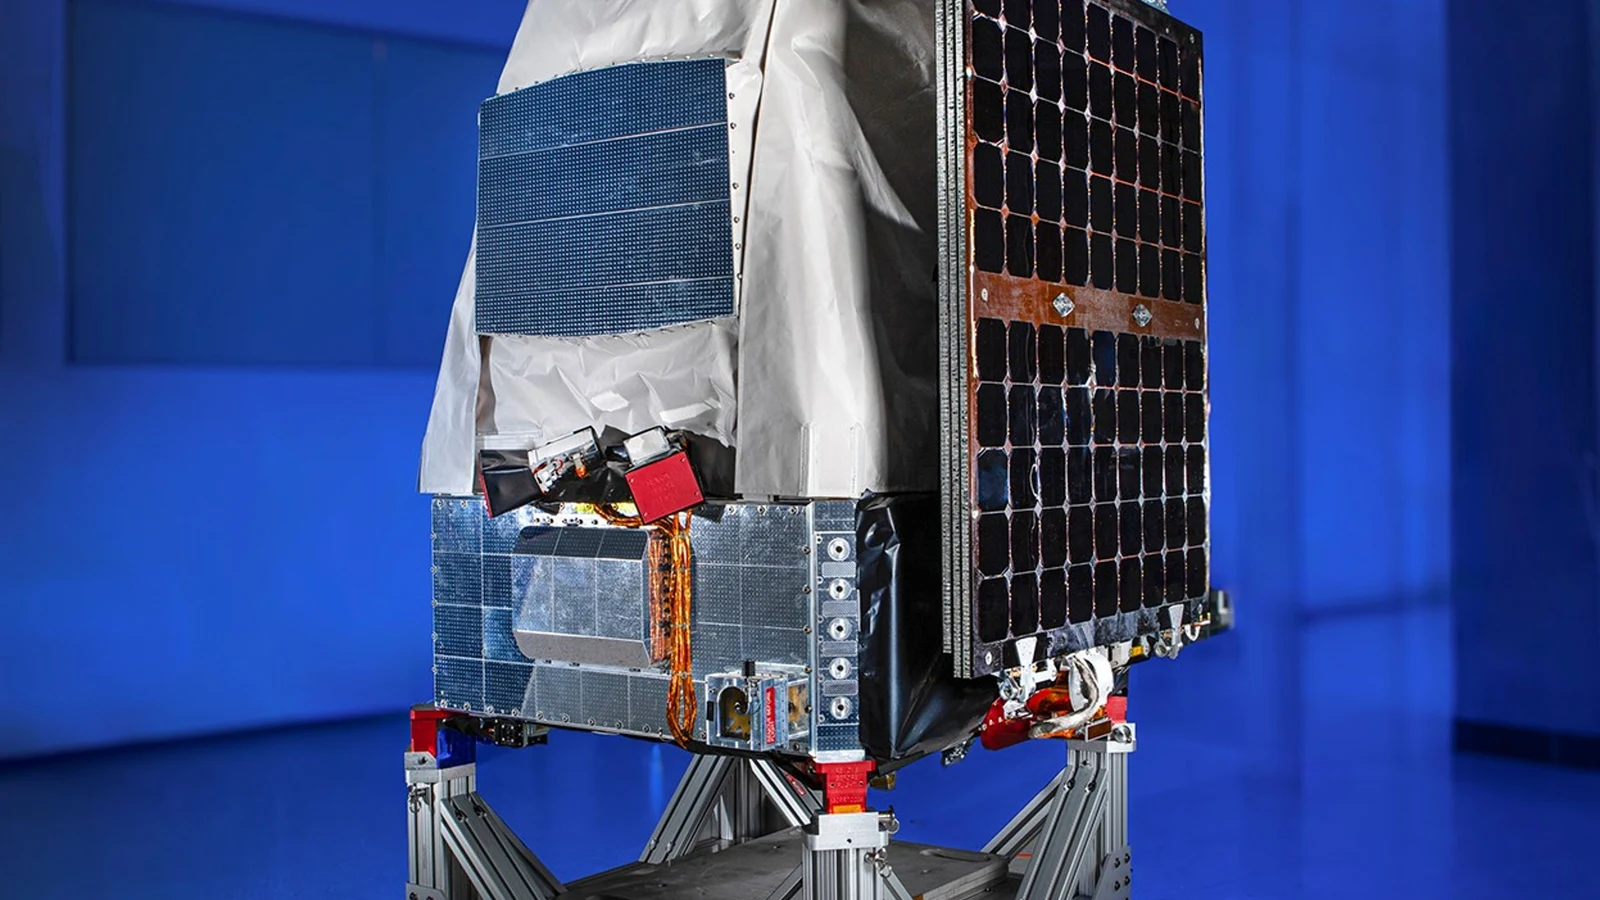
NASA's mission description therefore focuses on long-duration, multiwavelength observations rather than one dramatic snapshot. Pandora's visible channel follows the host star while its near-infrared detector builds the spectral record. This does not produce a separate photograph of the atmosphere. It creates two time-linked views of the same system, so the stellar contribution can be constrained before researchers ask what the remaining transit signal could mean.
How visible monitoring helps read the infrared spectrum
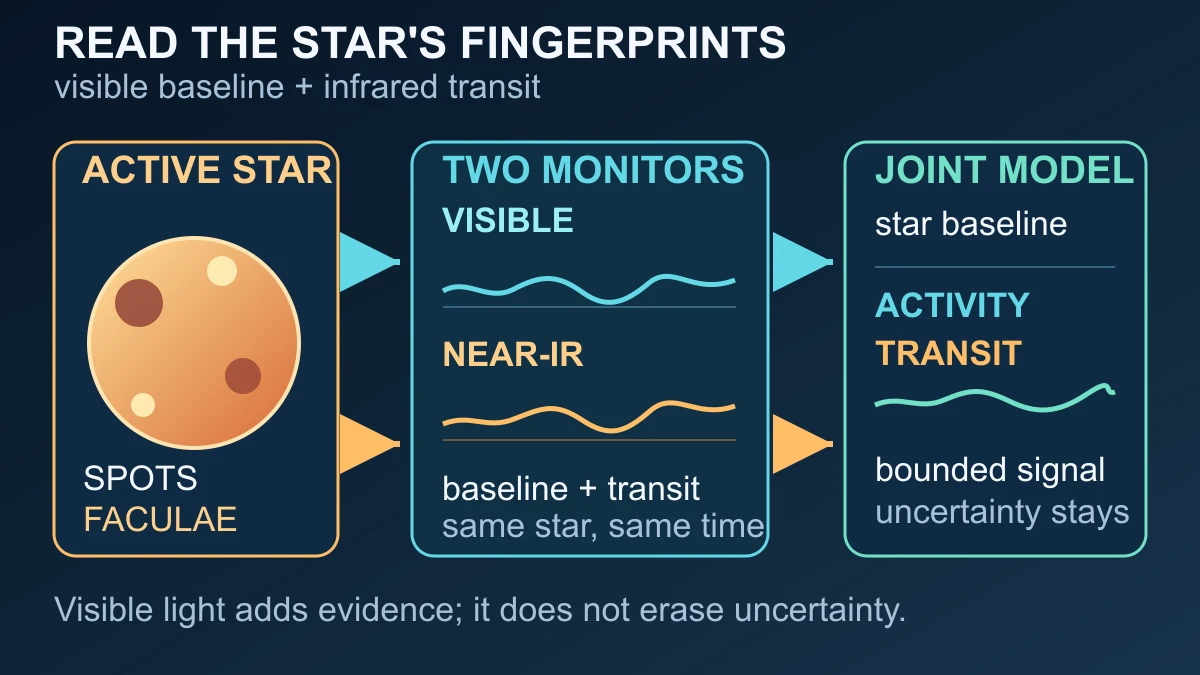
The visible light curve is useful because the host star is part of the measurement. Spots are cooler, darker regions; faculae are brighter regions associated with stellar activity. As the star rotates or its active regions change, the light arriving at the telescope changes even when the planet's atmosphere has not. The mission design paper describes Pandora's long visible photometry as a way to constrain that stellar photosphere while the near-infrared channel observes the transit.
The correction is a joint model, not a simple subtraction. One part of the fit describes the star's changing baseline and surface mixture; another describes the wavelength-dependent transit. The two records are taken together, which helps prevent a variation in the star from being silently assigned to the planet. The independent ExoPAG review explains why this matters across transmission spectroscopy: stellar heterogeneity is a known source of bias, not a detail that can be ignored after the spectrum is collected.
Pandora's simulations show both the promise and the boundary. Rackham and colleagues tested eight representative stellar-surface scenarios across 160 simulated datasets. In simpler spot-distribution cases, the model reduced simulated contamination from roughly 100–1,000 parts per million to about 10 parts per million or less. More complex geometries could leave residuals of roughly 1,000 parts per million, which is why the paper points to extra information such as spot crossings or joint retrievals. Those are model results, not measurements returned by Pandora in flight.
What Pandora can measure—and what it cannot prove
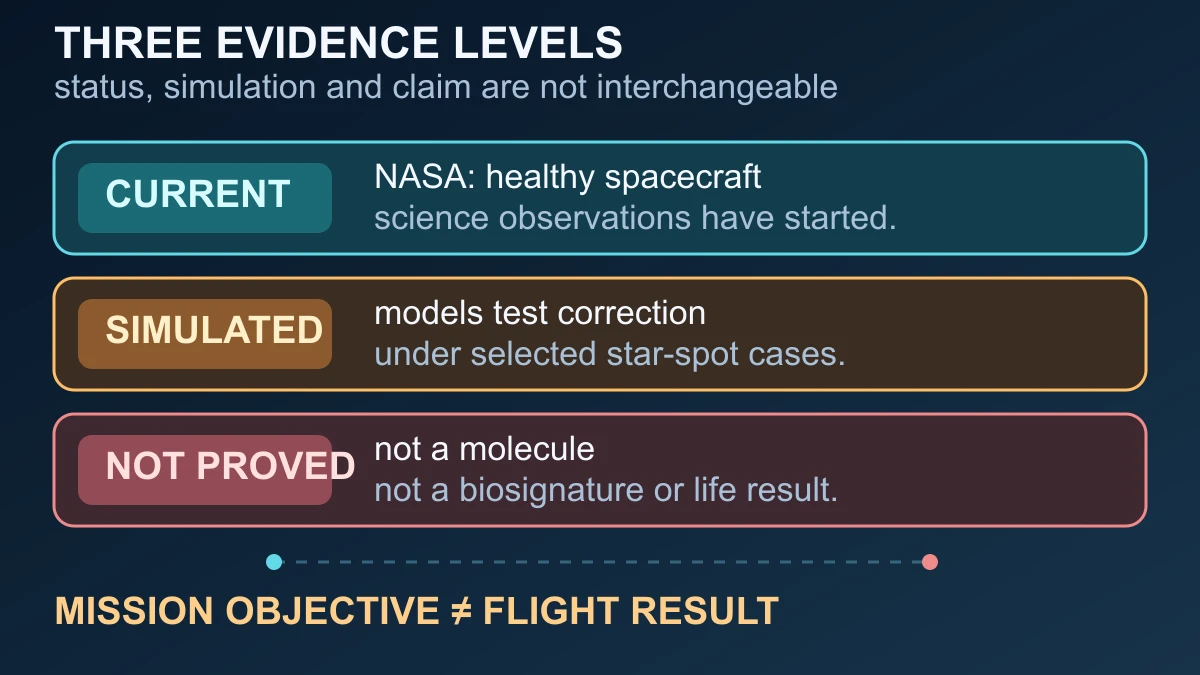
As of NASA's 25 August 2026 report, Pandora had begun making science observations and its spacecraft and instruments were healthy enough to start that work. NASA describes a one-year primary mission aimed at at least 20 exoplanets, with repeated observations of selected targets. Those statements establish the mission's current status and plan. They do not establish that Pandora has already identified water, a particular atmospheric molecule or a biosignature around any target.
A future dataset can contain measured detector counts, a visible-light time series and a near-infrared transit spectrum. An atmospheric abundance is a further inference from those measurements, calibration, stellar modelling and the assumptions used in a retrieval. Rotman's companion simulations explore what low-resolution near-infrared spectra might constrain in test cases; they are evidence about an analysis pipeline's expected behaviour, not proof that a flight dataset will produce the same result.
The honest promise is narrower and more useful: Pandora is designed to make the star less of a hidden confounder when astronomers read a planet's transit spectrum. Its two channels can bound some stellar activity, while difficult surface geometries can still leave ambiguity. The mission can therefore improve the evidence around an atmospheric interpretation without making every interpretation unique—and nothing in the current mission report proves life, a biosignature or a universal correction rule.
Sources and further reading
- NASA's Pandora Mission Begins Study of Exoplanets, Host Stars ↗
- NASA Science — Pandora mission overview ↗
- Quintana et al. — The Pandora SmallSat: Multiwavelength Characterization of Exoplanets and their Host Stars ↗
- Rackham et al. — Pandora simulations of stellar photospheric heterogeneity and its correction ↗
- Rotman et al. — Pandora simulated modeling and retrieval of near-infrared transmission spectra ↗
- Rackham et al. — NASA ExoPAG SAG21: The Stellar Contamination of Exoplanet Transmission Spectra ↗
- NASA — Guidelines for using NASA Images and Media ↗
This article was written for Curiosity Desk. We do not copy other publishers or invent quotes. If a material error is found, we correct it openly.
Read the full standards →One answer should lead to a better question
Bring your curiosity to the group
Curious Minds is our public Facebook community for surprising science, strange history, Australian wildlife and everyday questions. No copied posts, no personal-friend invitations and no link dumping.
- Three self-contained discussion prompts each week
- Sourced answers and honest uncertainty
- Respectful conversation without spam