The image sequence shows a rare regional event
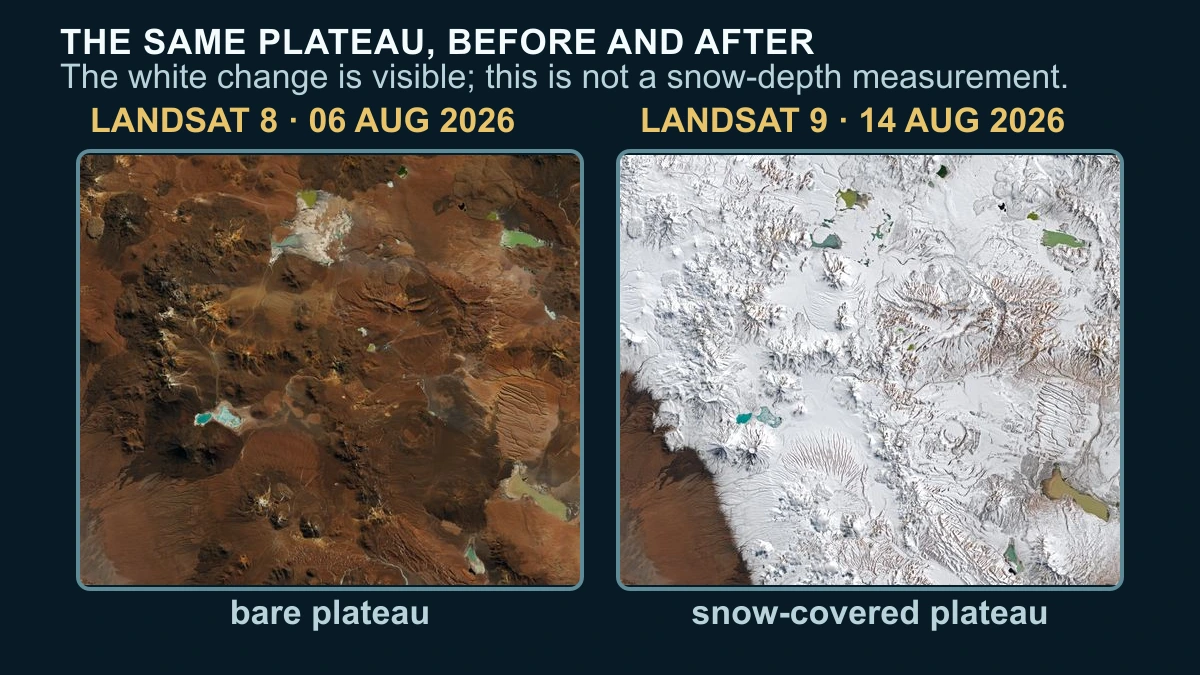
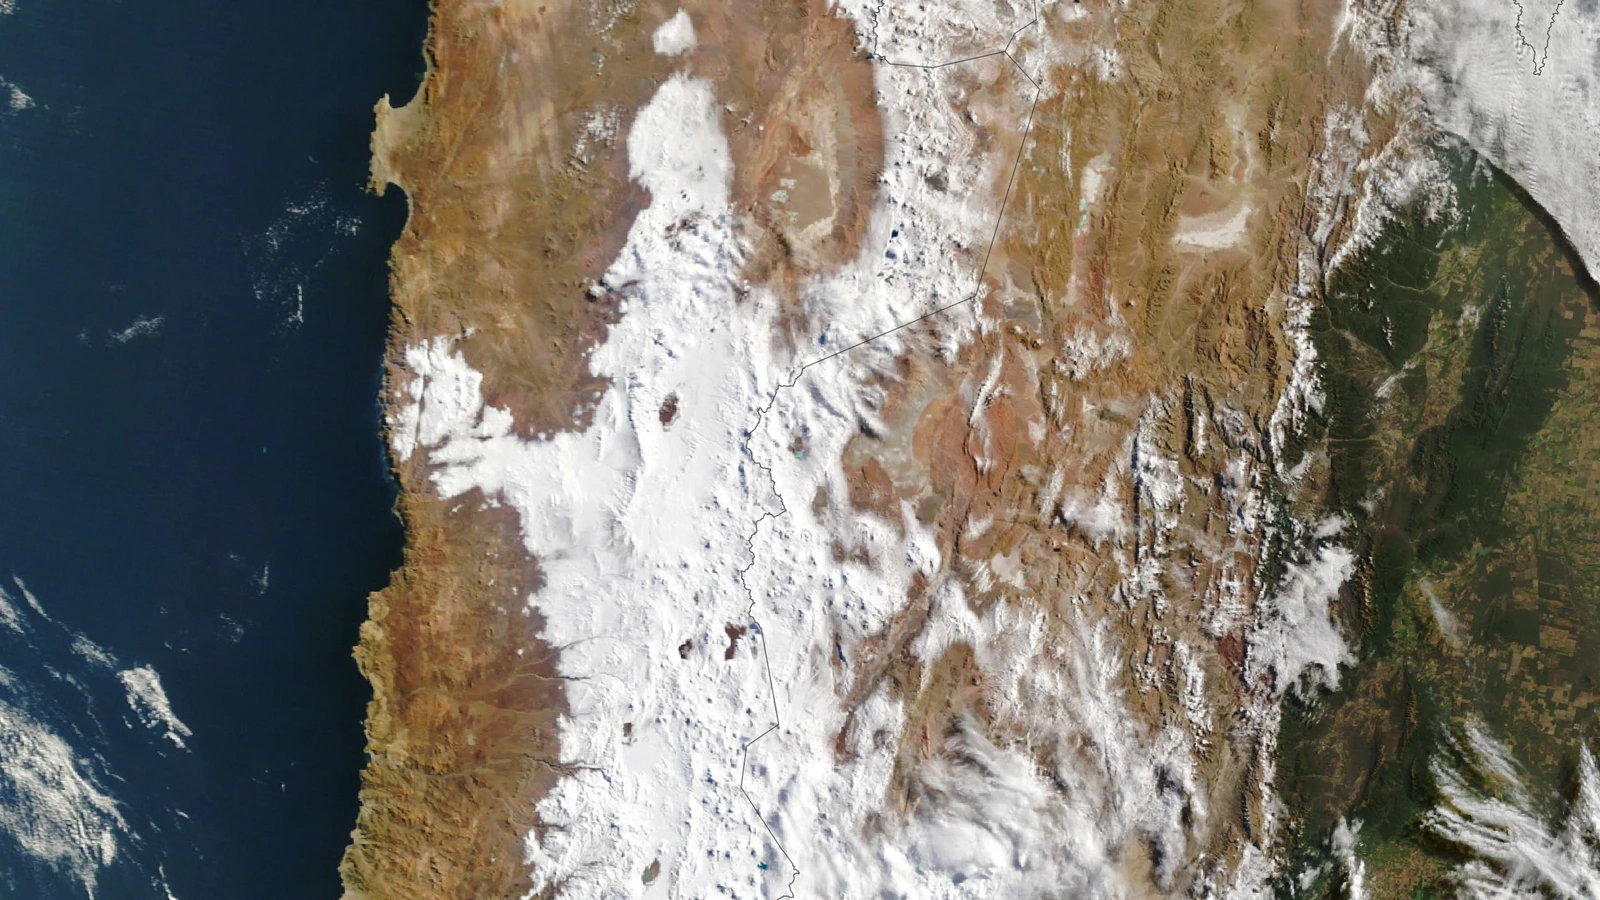
The quickest answer is visible in the date-stamped scenes: a Landsat 8 image from August 6 shows the Chajnantor plateau largely brown, a Landsat 9 image from August 14 shows the same plateau covered in bright snow, and a Terra MODIS image from August 19 shows a much wider white footprint across northern Chile. That sequence documents observed cover; it does not measure uniform snow depth, melt rate or future weather.
NASA describes the scenes as evidence of back-to-back winter storms in northern Chile. The broad MODIS view places the surprising part of the story between the Andes and Pacific coast, across the hyper-arid core south of Antofagasta. The interest is not simply that high mountains can turn white; it is that the snow reached terrain where precipitation is normally scarce.
That is also why the older 2025 NASA Earth Observatory comparison matters. It establishes that snowfall in the Atacama is possible, while the 2026 report describes this episode as unusually widespread. The comparison adds context without turning one rare event into a claim that the desert has permanently changed.
The dates also prevent a misleading shortcut. The detailed plateau change and the broad regional footprint are not a single instant captured at two zoom levels; they are observations made by different instruments on different days. The strongest story is therefore a sequence: snow appears on the plateau, then a later regional view shows how far the event reached.
Landsat and MODIS see different pieces of the same storm
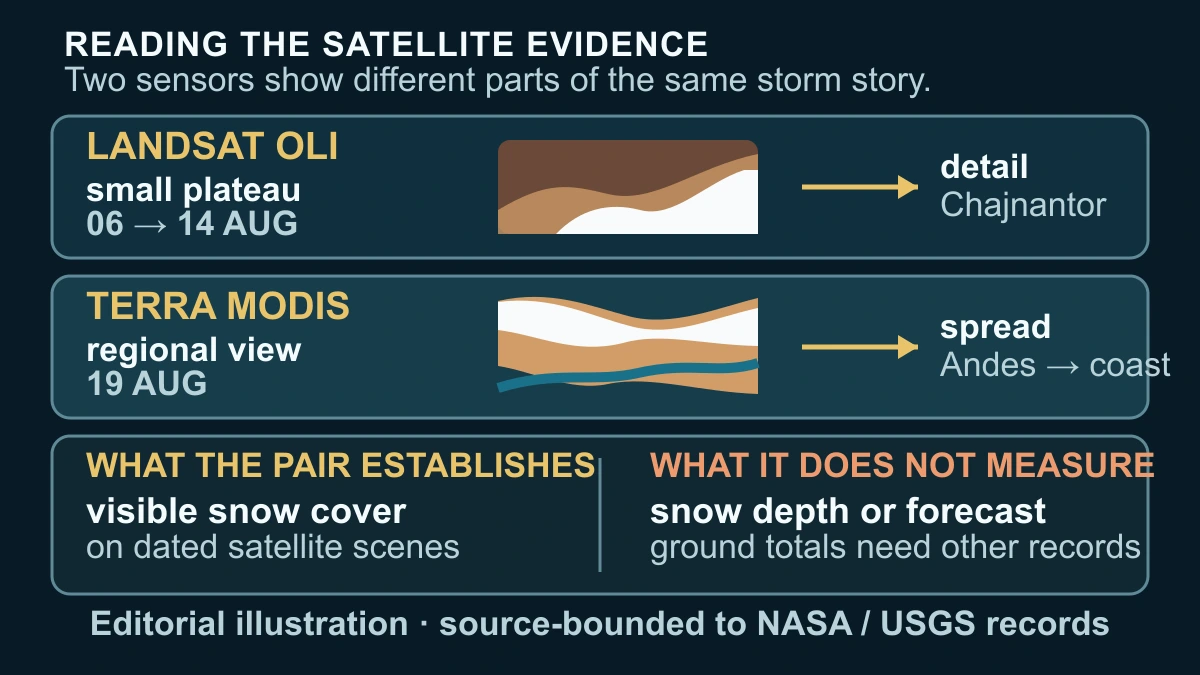
Landsat and MODIS answer different questions. Landsat's Operational Land Imager gives a more detailed look at a smaller land scene, which is why the August 6 and August 14 frames can show the plateau changing. MODIS on Terra gives a broader regional view, which is why the August 19 frame can show the reach of the snow at once.
Reading the pair together avoids a common satellite mistake: treating every white pixel as the same kind of evidence. The Landsat pair is the detailed before-and-after observation; the MODIS frame is the regional footprint. Differences in sensor, resolution, viewing date and product mean that the images should be compared as complementary views, not blended into a synthetic measurement.
The safe conclusion is therefore narrower and stronger: dated scenes show visible snow cover on the plateau and an unusually wide regional pattern. They cannot, on their own, tell us the average depth on the ground, how long each patch persisted, how much water entered a basin, or whether the same footprint will recur. Those questions need ground records, weather analysis and a longer record.
This division of labour is useful beyond this one storm. A high-resolution land sensor can make a before-and-after change legible, while a wider sensor can reveal the event's geography. Neither view is automatically the complete truth; the interpretation becomes more reliable when each image is asked only to support the question its scale and date can answer.
The atmosphere explains the reach, not the future
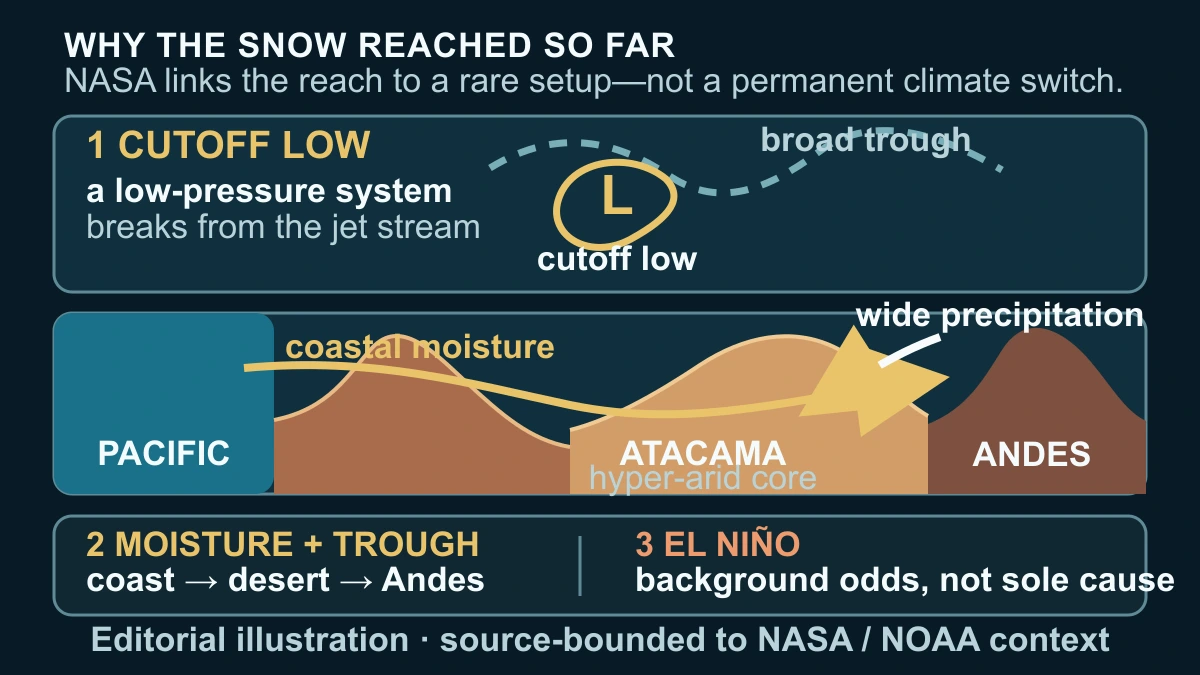
NASA's explanation starts with the atmosphere rather than a permanent change in the desert. Most winter precipitation in the region comes from cutoff lows—low-pressure systems that detach from the main jet-stream flow. NASA says the late-August system spun off an unusually large trough, helping precipitation reach farther west than usual.
The reach also depended on moisture. NASA links the event to coastal moisture and an atmospheric disruption that allowed precipitation to cross the hyper-arid interior; along the coast, some of that precipitation fell as rain rather than snow. This is a mechanism for this storm's reach, not a complete local forecast model.
NOAA's August 13 ENSO discussion supplies background, not a verdict: it said El Niño was strengthening and that impacts were more likely, while also warning that impacts are not guaranteed. So the honest boundary is: the satellites record an unusual 2026 event, and the atmospheric setup offers an explanation; neither proves El Niño alone caused it, that the event is a climate trend, or that another wide snowfall is coming.
Sources and further reading
- NASA Earth Observatory — Rare, Widespread Snow in the Atacama Desert ↗
- NASA Earth Observatory — Rare Snowfall in the Atacama Desert (2025 comparison) ↗
- U.S. Geological Survey — Landsat 8 mission and Operational Land Imager ↗
- U.S. Geological Survey — Landsat 9 mission and data products ↗
- NASA Earthdata GIS — True Color Corrected Reflectance MODIS/Terra overview ↗
- NOAA Climate Prediction Center — ENSO Diagnostic Discussion, Aug. 13, 2026 ↗
- NASA — Guidelines for using NASA Images and Media ↗
This article was written for Curiosity Desk. We do not copy other publishers or invent quotes. If a material error is found, we correct it openly.
Read the full standards →One answer should lead to a better question
Bring your curiosity to the group
Curious Minds is our public Facebook community for surprising science, strange history, Australian wildlife and everyday questions. No copied posts, no personal-friend invitations and no link dumping.
- Three self-contained discussion prompts each week
- Sourced answers and honest uncertainty
- Respectful conversation without spam