One far-off camera can see a whole storm pattern
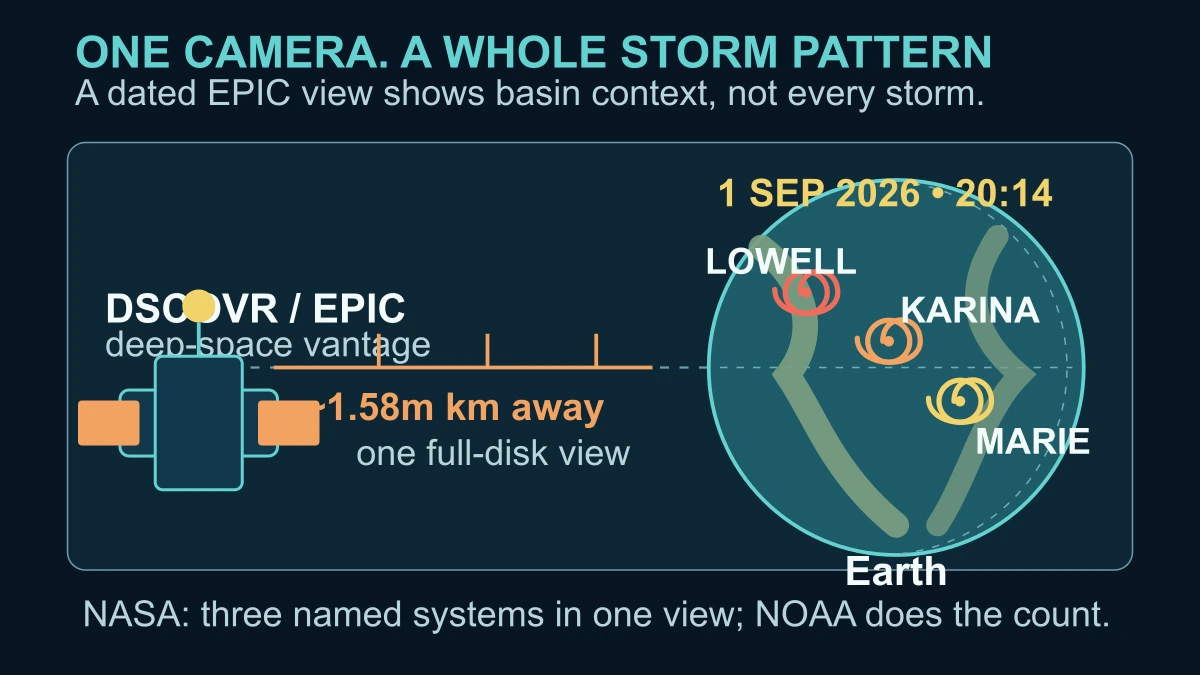
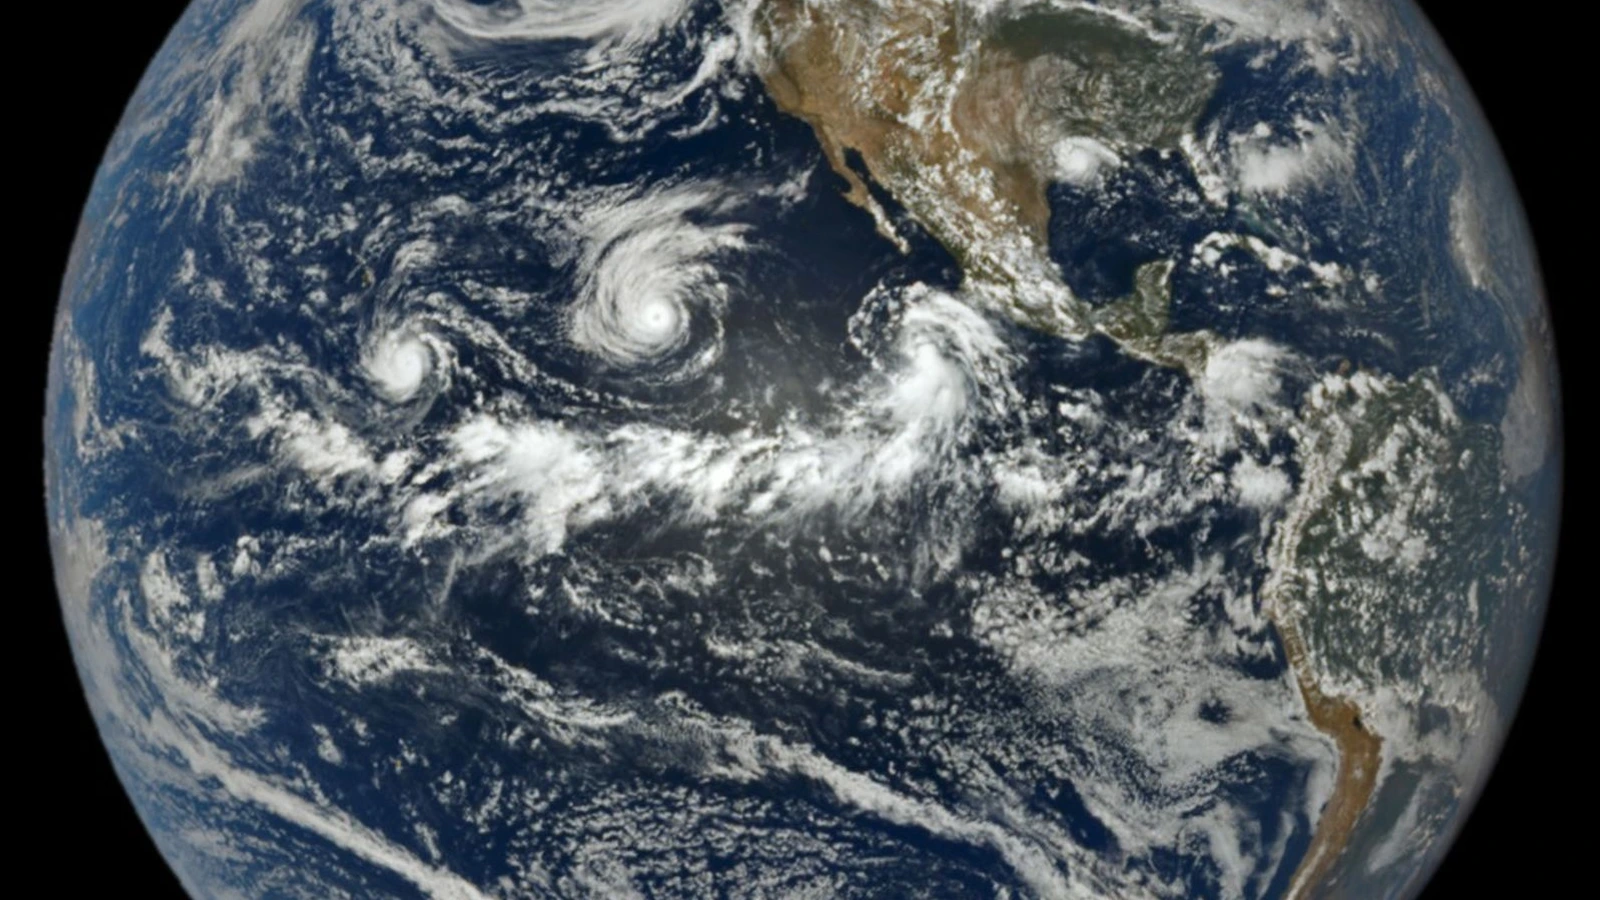
The short answer is that satellites widen the question before they answer it. NASA's Earth Observatory report says DSCOVR's EPIC instrument captured the sunlit Earth on September 1, 2026, at 20:14 UTC, with Lowell, Karina and Marie visible in the Pacific at once. From DSCOVR's deep-space vantage, the useful fact is the shared view: several named systems appear as part of one basin-scale weather scene, rather than as isolated pictures encountered one at a time.
That wide view does not turn EPIC into a census instrument. It shows what was visible in one dated observation and makes the spatial pattern easy to grasp; it does not list every disturbance, replace the National Hurricane Center's storm records or reveal the future path of any system. The image is powerful because it gives the story an immediate answer—three named Pacific cyclones together—and an honest next question: how do scientists decide what counts as a busy season?
A storm count needs a basin and a definition
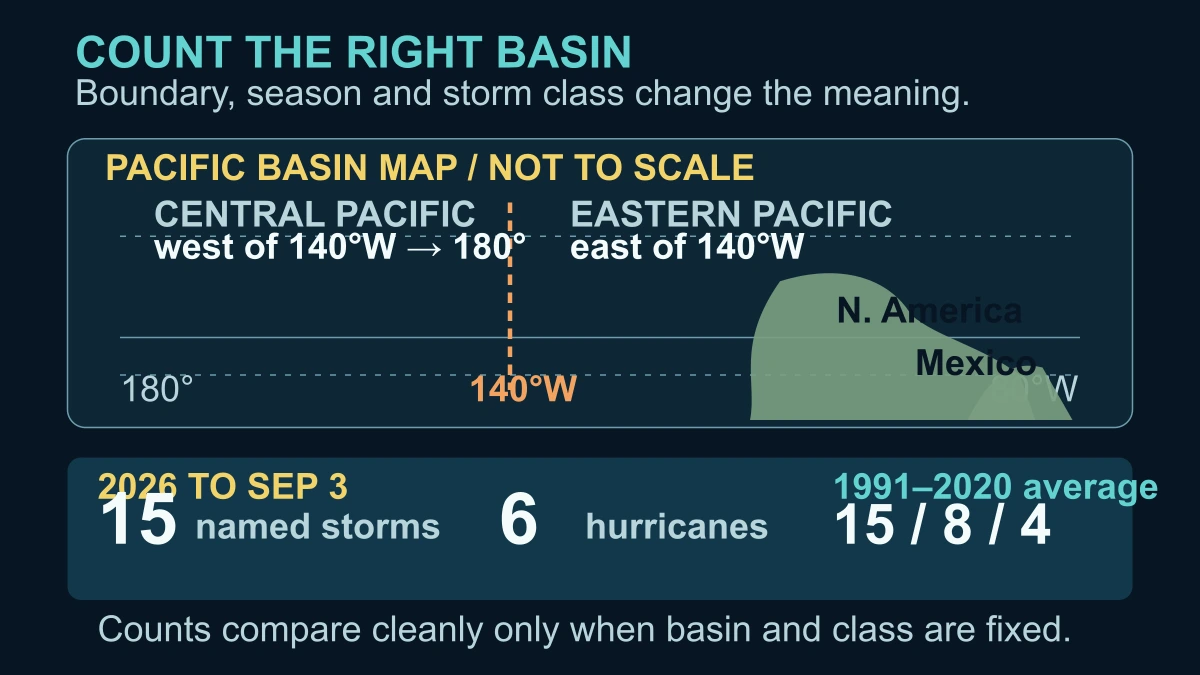
The number only becomes interpretable after the boundary, season and storm class are fixed. NOAA's National Hurricane Center describes the eastern Pacific region east of 140 degrees west and the Central Pacific region west of 140 degrees west to the International Date Line. Its eastern Pacific season runs from May 15 through November 30, with most activity concentrated from late June into early October. NASA reported that, as of September 3, the Northeast Pacific had 15 named storms and six hurricanes.
Those labels are not interchangeable. The NHC's 1991–2020 eastern Pacific averages are 15 named storms, eight hurricanes and four major hurricanes across a full season; a running September count has not finished its denominator. The NHC data archive also separates current reports from post-analysis best-track records such as HURDAT2. So 15 named storms by September 3 tells us the season had already reached the long-run named-storm average, while the class breakdown and later records determine how the final season compares.
El Niño changes the backdrop, not one storm's address
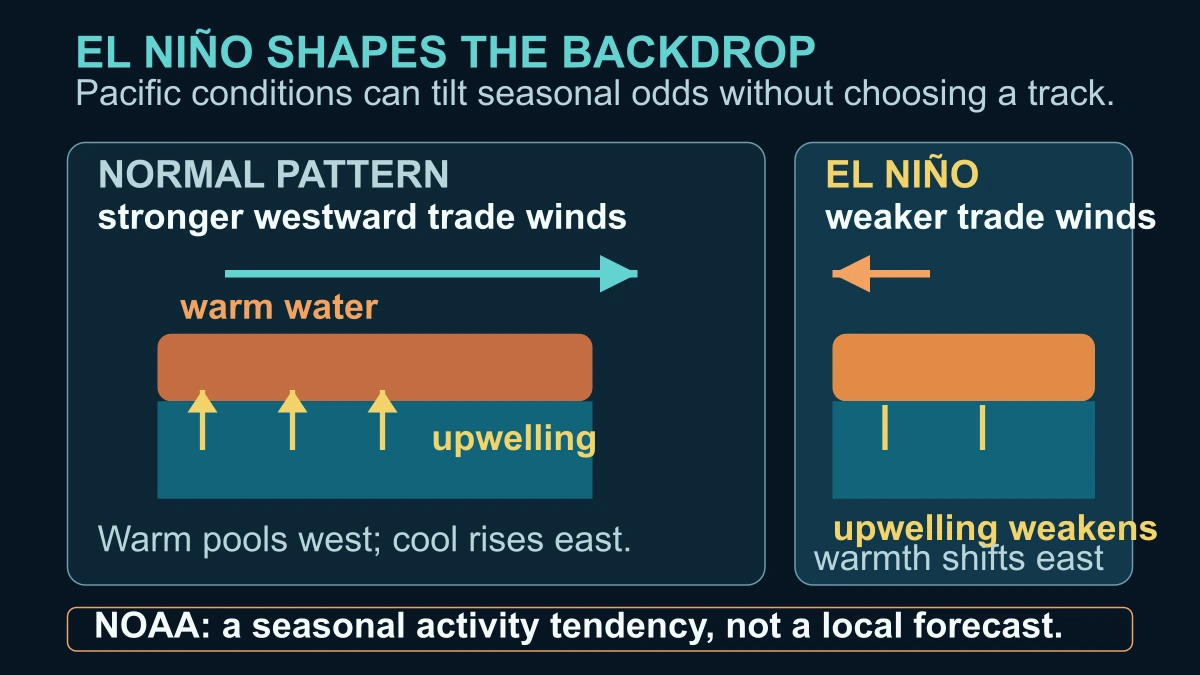
NOAA's 2026 Eastern Pacific outlook assigns a 70 percent chance to an above-normal season and gives a range of 15 to 22 named storms, nine to 14 hurricanes and five to nine major hurricanes. The outlook also expects El Niño during the season and explains that warmer sea-surface temperatures and a more supportive wind environment can favour activity in the eastern and central Pacific. NASA describes the physical backdrop as warmer central and eastern tropical Pacific water, weaker trade winds, reduced upwelling and a shifted circulation pattern.
That is a seasonal influence, not a storm address. A climate pattern can change the odds across a basin, while each tropical cyclone still develops, strengthens, weakens and moves through shorter-term conditions. NOAA explicitly says its seasonal outlook is a broad guide, not a forecast for a particular locality or landfall; those details become predictable only nearer to an approaching system. The useful distinction is therefore simple: El Niño can help explain why the season's background is favourable, but it cannot tell a reader where one named storm will go.
What a satellite frame and a regional count cannot prove
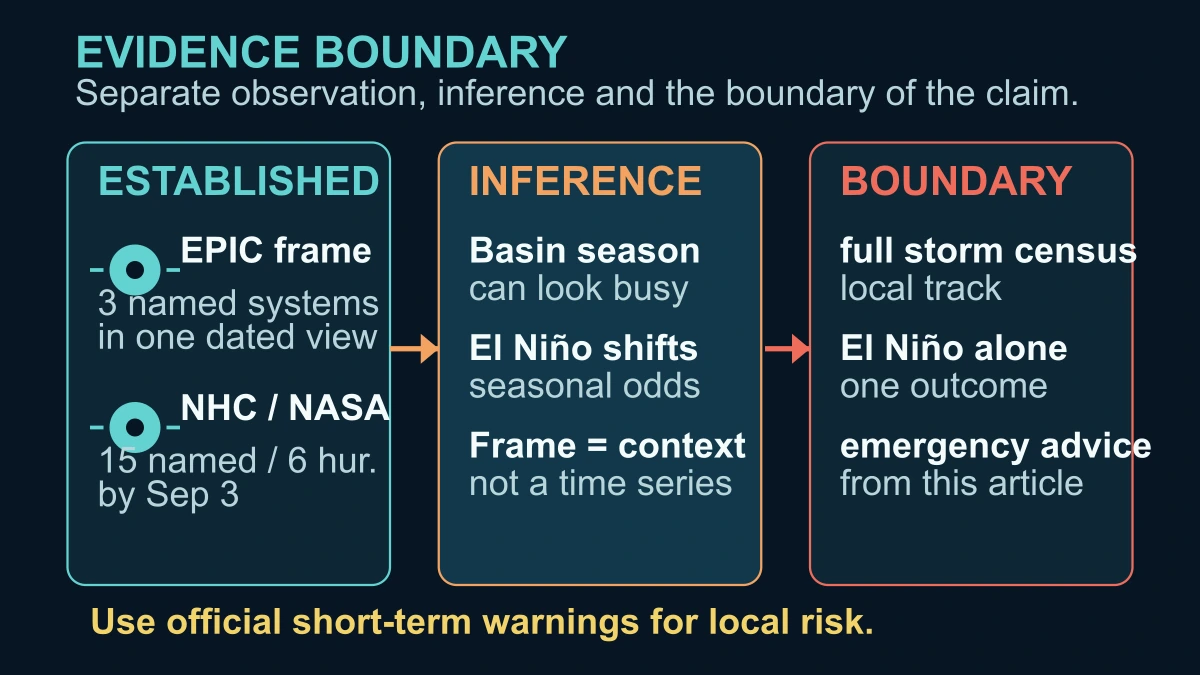
Established here are three different evidence types: NASA's dated EPIC frame shows Lowell, Karina and Marie together; the NASA report records 15 named storms and six hurricanes in the Northeast Pacific by September 3; and NOAA's outlook supplies a probabilistic seasonal comparison with an El Niño context. The original explanation is the connection among them. A wide image makes the pattern visible, a defined count makes the comparison meaningful and the ocean-atmosphere mechanism explains why a seasonal tendency can exist without becoming a deterministic forecast.
Still uncertain or not proved are just as important. One frame is not a complete storm census, a regional count is not a local track or landfall prediction and El Niño alone is not proof that one storm had one cause. The package also does not provide personal emergency, boating or evacuation advice. For a particular place, the next safe evidence route is the current official short-term forecast and warning; for the season's final accounting, it is the updated NHC record and later analysis.
Sources and further reading
- NASA Earth Observatory — A Trio of Tropical Cyclones in the Pacific ↗
- NOAA National Hurricane Center — Tropical Cyclone Climatology ↗
- NOAA National Hurricane Center — Data Archive ↗
- NOAA Climate Prediction Center — 2026 Eastern Pacific Hurricane Season Outlook ↗
- NASA Science — El Niño ↗
- NASA EPIC — DSCOVR Earth Polychromatic Imaging Camera ↗
- NOAA NESDIS — DSCOVR: Deep Space Climate Observatory ↗
- NASA — Guidelines for using NASA Images and Media ↗
This article was written for Curiosity Desk. We do not copy other publishers or invent quotes. If a material error is found, we correct it openly.
Read the full standards →One answer should lead to a better question
Bring your curiosity to the group
Curious Minds is our public Facebook community for surprising science, strange history, Australian wildlife and everyday questions. No copied posts, no personal-friend invitations and no link dumping.
- Three self-contained discussion prompts each week
- Sourced answers and honest uncertainty
- Respectful conversation without spam