A 3D map is built from overlapping views
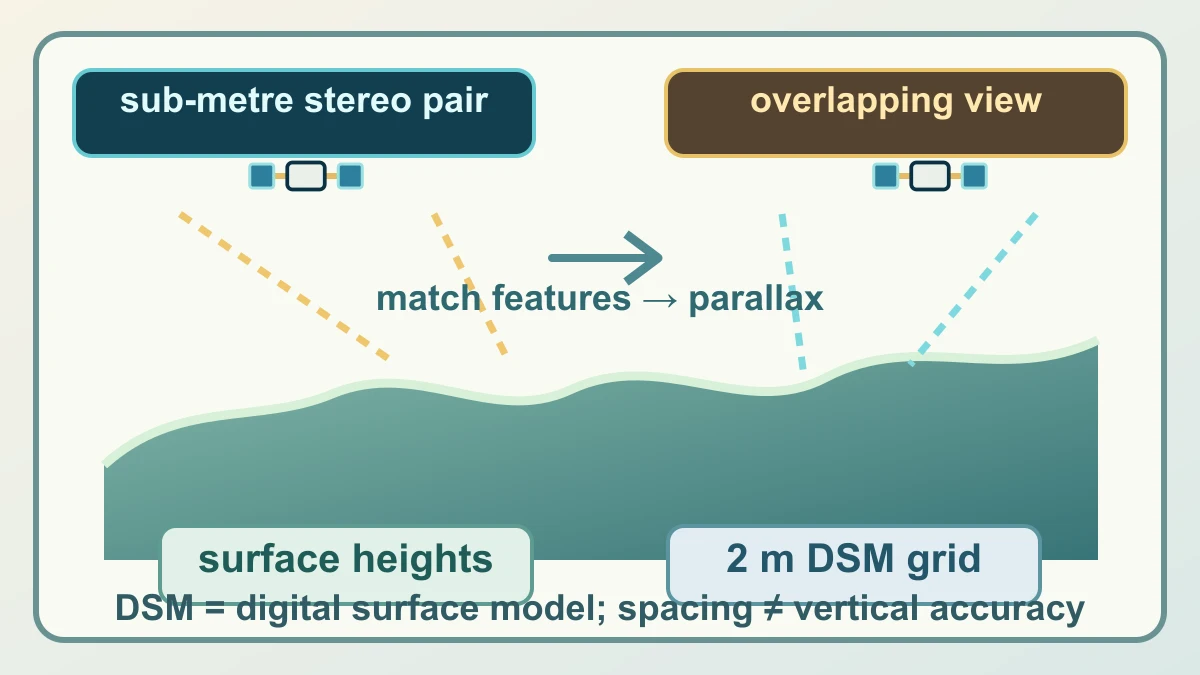
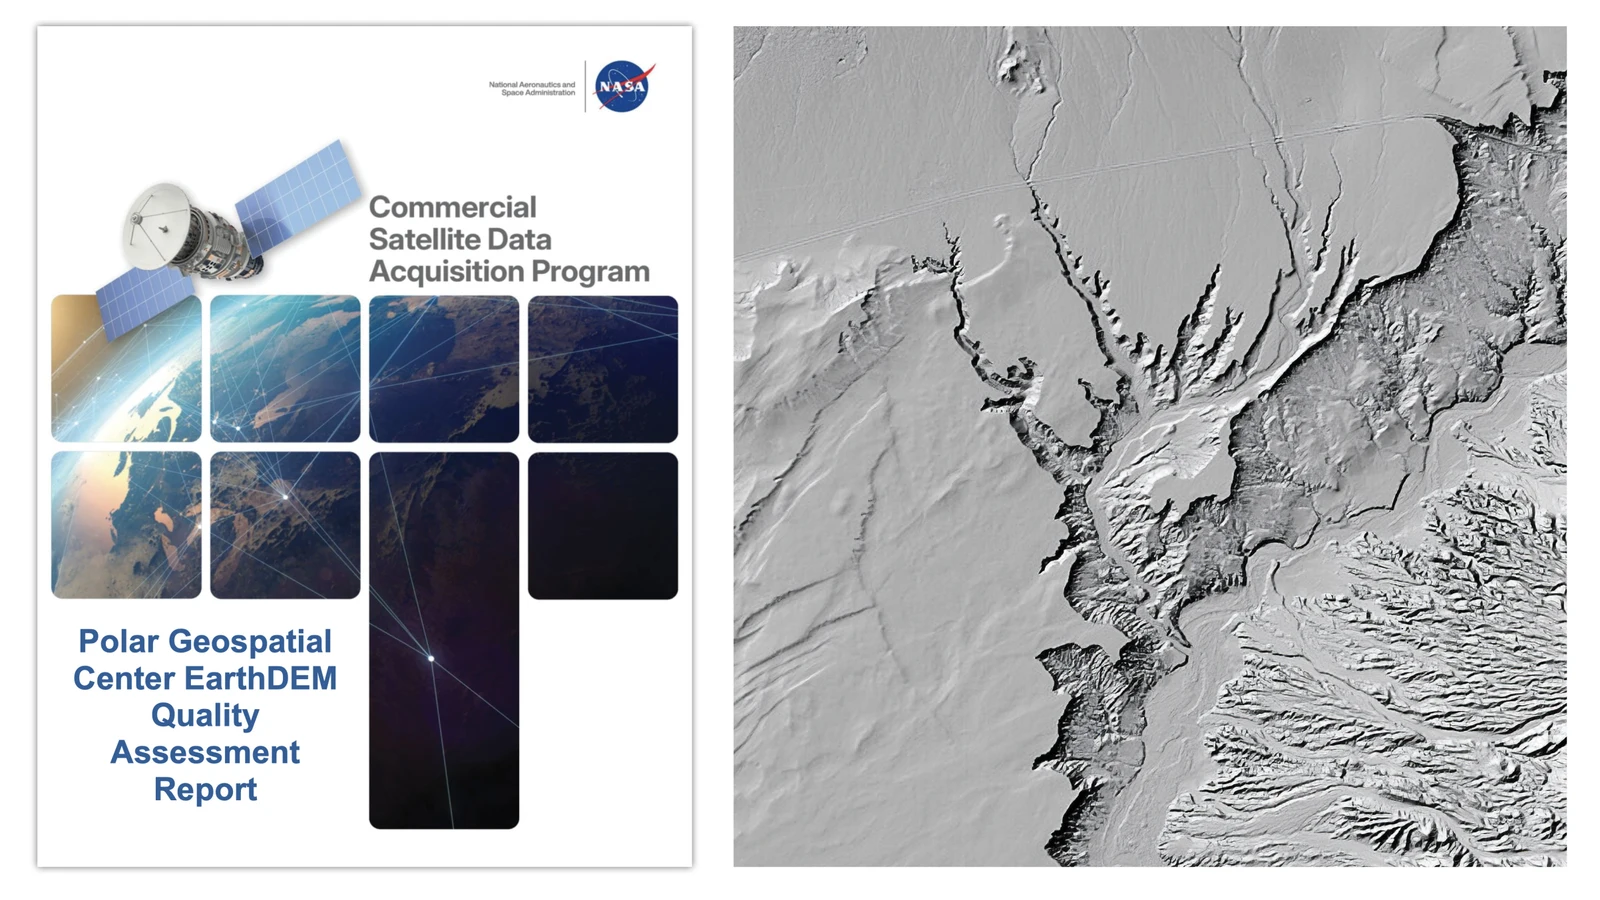
EarthDEM is a digital surface model, or DSM: a map of the visible surface rather than a promise that every elevation is known to centimetre precision. The Polar Geospatial Center describes the product as a two-metre dataset built from hundreds of thousands of stereo-derived elevation models made from very high-resolution commercial satellite imagery. It has strip products that preserve acquisition dates and mosaic products that combine repeated strips, with extra metadata about repeat counts, spread and time range.
The basic measurement is parallax. The same patch of ground appears from two slightly different satellite positions, so matching features shift by an amount related to their height. Processing those matches turns image geometry into surface heights and then a regular grid. That explains why spatial resolution and vertical accuracy must be kept separate: a two-metre grid says how the surface is sampled, not that each cell's height is within two metres of the truth. A good explanation therefore starts with how the model is made before quoting any score.
Scientists check the model against airborne lidar
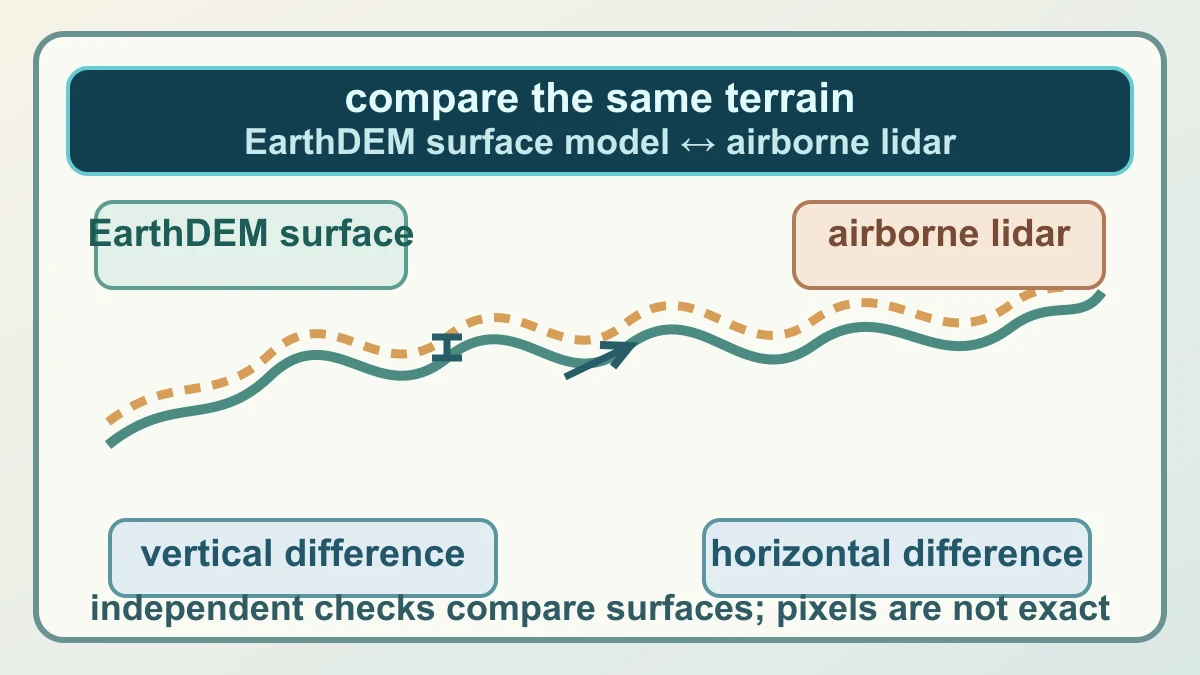
An accuracy check needs an independent reference. NASA's 12 August 2026 assessment of the Polar Geospatial Center's EarthDEM products compared the Strip DSM and Mosaic Tile DSM with airborne lidar samples across parts of the United States and Senegal. Lidar supplies a separate height measurement for the same terrain, so the comparison can test how far the satellite-derived surface differs from a reference rather than simply checking whether the product agrees with its own processing pipeline.
The report separates horizontal and vertical error because they answer different questions. Horizontal accuracy asks whether a feature is in the right place; vertical accuracy asks whether its height is close to the reference. The summary statistic is RMSE, the root mean square error across the tested samples. RMSE is useful for comparing products and conditions, but it is not a maximum-error guarantee and it does not make every pixel equally reliable. The sample areas, land cover and data-quality conditions remain part of the result.
That reference design also explains why a quality assessment is more useful than a single badge. The satellite product and lidar are aligned over comparable terrain, differences are summarised across the tested samples and the result can be split by product or condition. A reader can then ask the practical follow-up: was the relevant error horizontal or vertical, did the test include the land cover of interest and do the product's missing features or voids matter for the intended analysis? Those questions keep a published number attached to the evidence that produced it. The comparison is a chain of measurements, not a magical conversion of a model into ground truth: each link contributes context, and each limitation remains part of the answer.
The result is useful only within its limits
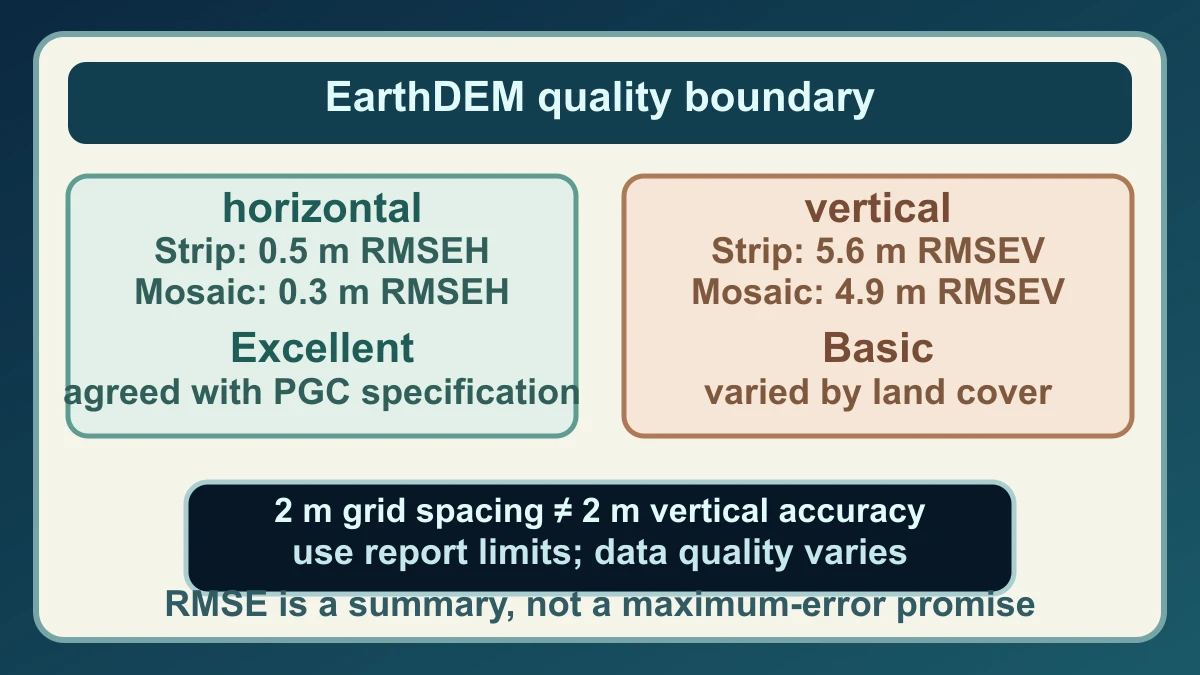
NASA's summary reports horizontal RMSEH of 0.5 metres for the Strip product and 0.3 metres for the Mosaic product; both agreed with the Polar Geospatial Center specification and received an Excellent grade for that dimension. The vertical results were 5.6 metres RMSEV for Strip and 4.9 metres for Mosaic, and the assessment graded vertical accuracy Basic. Vertical performance varied by land cover, while Strip results also varied with the cloud metadata available for the imagery. The numbers are therefore evidence about tested product behaviour, not a universal label for every landscape.
NASA says the products can be useful when their characteristics fit the job, while also identifying poor cloud masking, missing surface features and data voids as important limits. The Polar Geospatial Center documents that EarthDEM is not registered with ground control or altimetry, and access to the general product is restricted to federal employees, contractors and federally funded researchers, with a Great Lakes subset public. Those boundaries rule out treating this package as navigation, surveying, flood-risk or safety advice. The honest answer is simpler: scientists check a satellite-derived 3D map by comparing it with an independent reference, report the differences by dimension and keep the uncertainty attached to the use case.
Sources and further reading
This article was written for Curiosity Desk. We do not copy other publishers or invent quotes. If a material error is found, we correct it openly.
Read the full standards →One answer should lead to a better question
Bring your curiosity to the group
Curious Minds is our public Facebook community for surprising science, strange history, Australian wildlife and everyday questions. No copied posts, no personal-friend invitations and no link dumping.
- Three self-contained discussion prompts each week
- Sourced answers and honest uncertainty
- Respectful conversation without spam