The balloon flight is a moving measurement platform
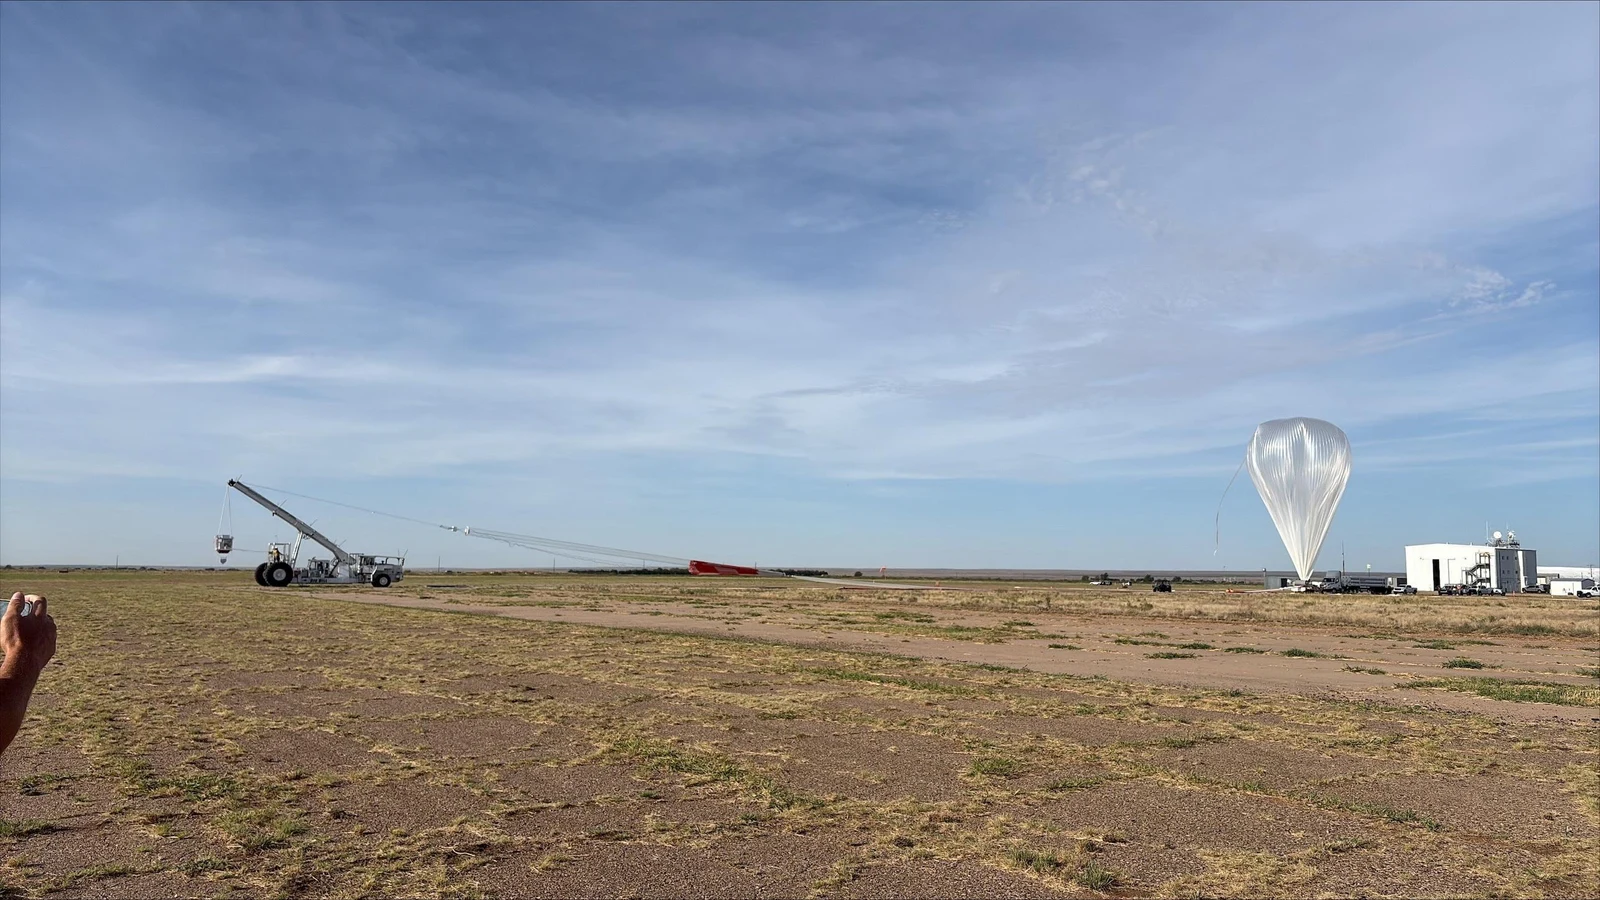
A scientific balloon makes altitude part of the experiment. NASA's 22 August 2026 Wallops report says the first Fort Sumner flight of the Salter campaign was a technology test that reached about 123,000 feet and lasted 4 hours 8 minutes. The useful fact is not simply that a balloon went up: the flight train carried hardware through changing layers of air while the mission team tracked where and when the test occurred.
NASA's programme describes scientific balloons as platforms that can carry instruments above most of the atmosphere for observations and technology demonstrations. The balloon design, payload mass, float altitude, telemetry and flight duration are linked choices. A zero-pressure balloon, for example, can vent gas through ducts as it warms and expands, allowing it to remain near a selected float level rather than behaving like a sealed toy balloon.
That context matters because the Salter report identifies the flight as a technology test and mentions roughly 100 small payloads riding along, but it does not say that the Salter payload produced an ozone profile. A photograph can show the vehicle and a campaign update can establish the flight record. It cannot fill in an unreported instrument configuration, so this explanation keeps the exact flight and the related sensor method separate.
How sensors turn changing altitude into a profile
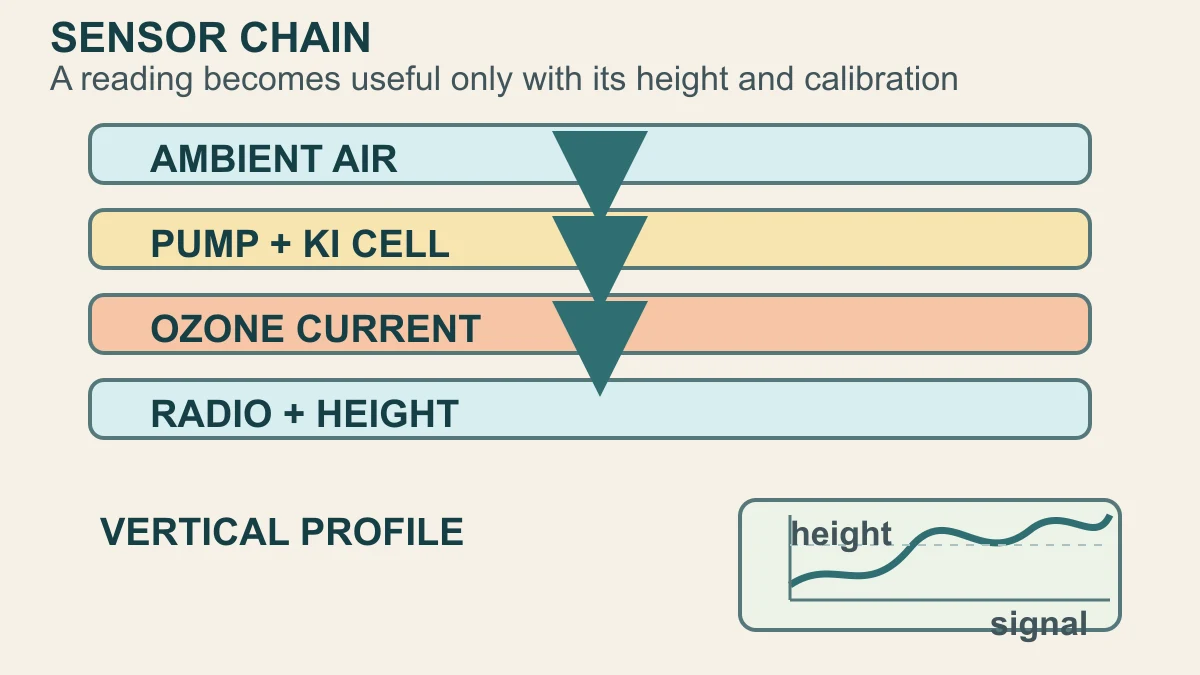
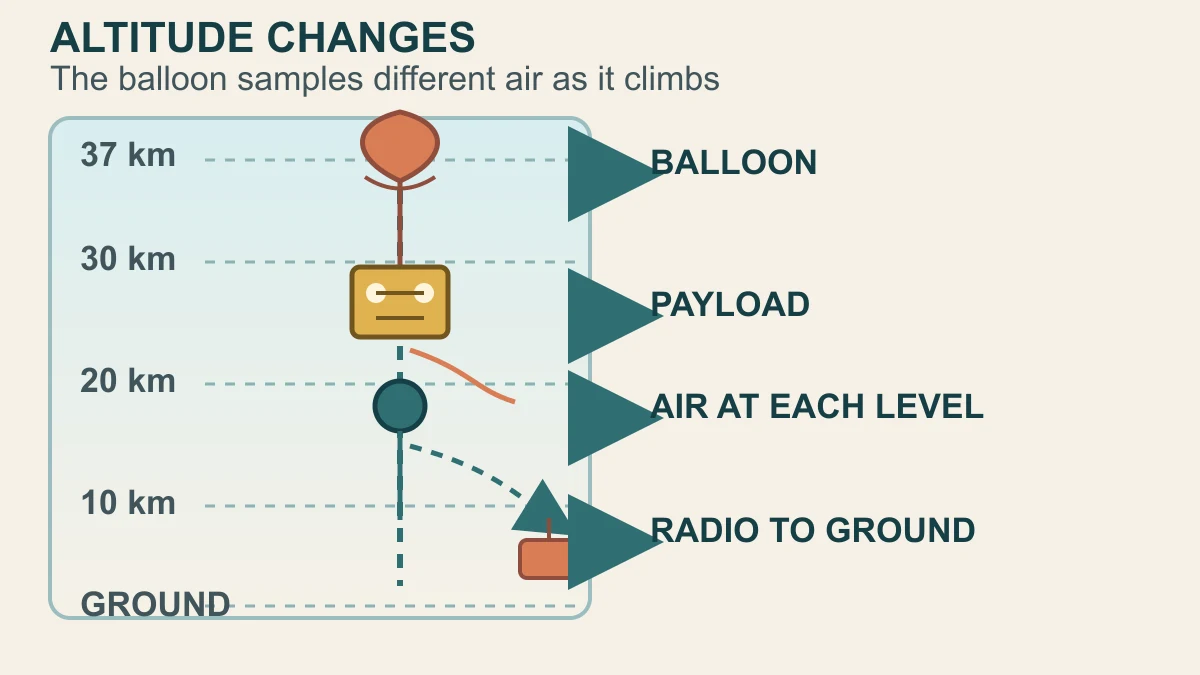
The measurement logic is easiest to see in a related NASA fieldwork example. NASA's 2026 student weather-balloon account describes an ozonesonde attached to a balloon, with prepared electrochemical cells and a data system that follows the instrument until the balloon pops or the flight train lands. The instrument is not measuring an abstract atmosphere; it is sampling air at successive positions while the balloon's height changes.
The NASA LARC NDACC protocol gives the mechanism more precisely for a standard Brewer-Mast-type ozonesonde. A pump draws ambient air through a potassium-iodide solution, and the chemical reaction produces an electrical current related to the ozone in that air. The instrument records that signal with altitude and other flight information, turning many time-ordered readings into a vertical profile rather than one undifferentiated number.
The chain therefore has several links that must stay attached: the air sample, the sensor chemistry, the current, the height or pressure coordinate, the timing and the calibration. If any link is missing, the line on a chart can look more authoritative than its evidence. NASA's protocol notes that ozonesondes are normally flown once and require standard operating procedures and calibration, which is why a profile is a measured record with method-specific limits, not a universal atmospheric label.
What one flight can establish—and what it cannot
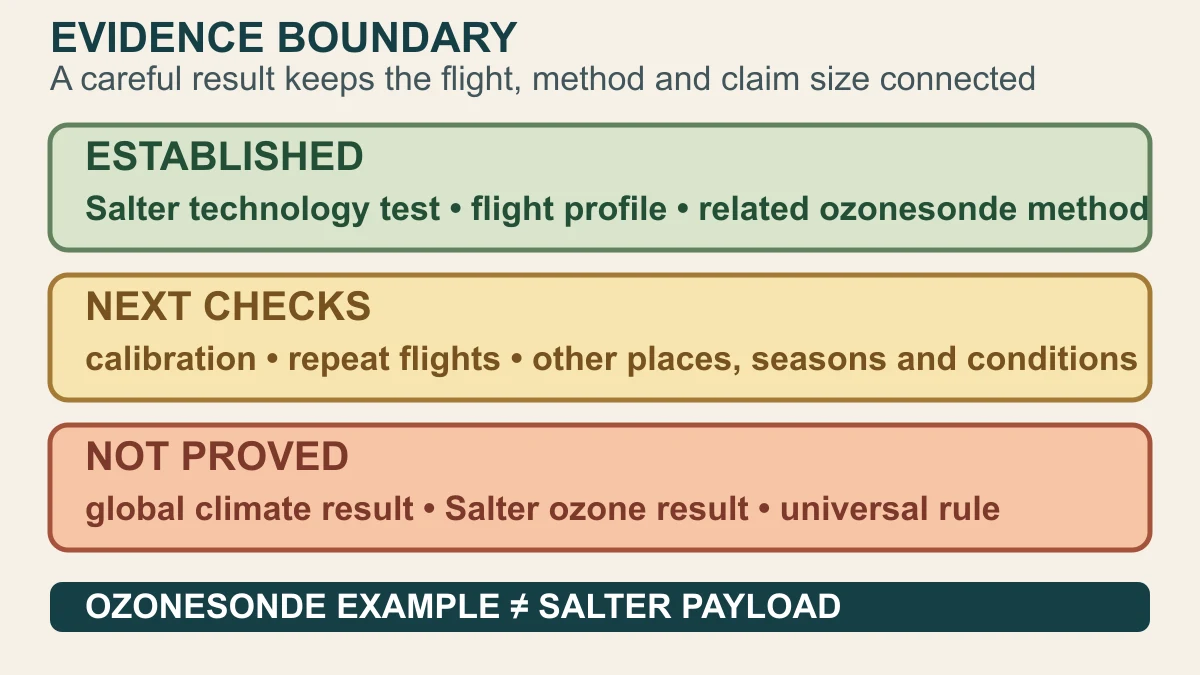
One well-documented flight can establish where an instrument travelled, when it sampled, what its calibrated signal represented and how the readings varied with height. It can reveal a profile for that flight's location and conditions, and it can test whether the hardware, telemetry and recovery workflow behaved as intended. Those are meaningful results because they connect the measurement to a reproducible procedure instead of treating a launch image as data.
The same flight cannot, by itself, establish how the whole atmosphere behaved across regions, seasons or weather regimes. It cannot prove a long-term climate trend, and the related NASA ozonesonde example cannot be silently reassigned to the Salter technology test. To extend a local vertical record, researchers need calibration evidence, repeat flights, comparable conditions and a documented way to evaluate uncertainty across the observations.
The honest headline is consequently narrower and more useful: a balloon turns changing altitude into an organised atmospheric record by carrying sensors through the air and preserving the height of each reading. NASA's current campaign documents the platform and the Salter test; the ozonesonde sources explain one established sensor pathway. The broader conclusion remains open until the specific payload, data and repeat evidence are actually reported.
Sources and further reading
- NASA Wallops — NASA Launches First Scientific Balloon of Fort Sumner Campaign ↗
- NASA Wallops — NASA Scientific Balloons Prepare for 2026 Fort Sumner Campaign ↗
- NASA — Scientific Balloons programme overview ↗
- NASA — Balloon Program Capabilities ↗
- NASA Science — Up, Up, and Away With Weather Balloons ↗
- NASA Science — Students Take on Airborne Field Research with NASA ↗
- NASA LARC NDACC — Appendix V: Ozonesonde Instruments ↗
- NASA Earthdata — NOAA-O3 archived suborbital instrument record ↗
- NASA — Scientific Balloon Program fact sheet ↗
This article was written for Curiosity Desk. We do not copy other publishers or invent quotes. If a material error is found, we correct it openly.
Read the full standards →One answer should lead to a better question
Bring your curiosity to the group
Curious Minds is our public Facebook community for surprising science, strange history, Australian wildlife and everyday questions. No copied posts, no personal-friend invitations and no link dumping.
- Three self-contained discussion prompts each week
- Sourced answers and honest uncertainty
- Respectful conversation without spam