A pollution source is a pattern, not a single reading
A sensor can tell researchers that particulate matter or black carbon is present, but one reading rarely tells them where it came from. A road, a cooking fire, a seasonal burn, a weather inversion and a passing plume can all change the number at one place. The useful question is therefore not whether a single measurement is high or low. It is whether a repeated pattern appears across time, locations and the movement of air.
Black carbon is a light-absorbing component of fine particulate matter, while PM2.5 describes particles small enough to remain suspended and enter deep parts of the respiratory system. That definition explains what the instruments measure; it does not turn a citywide research result into advice about one person's exposure. The Addis Ababa study is valuable because it treats the measurements as an evidence problem: several kinds of signal have to agree before a source explanation becomes plausible.
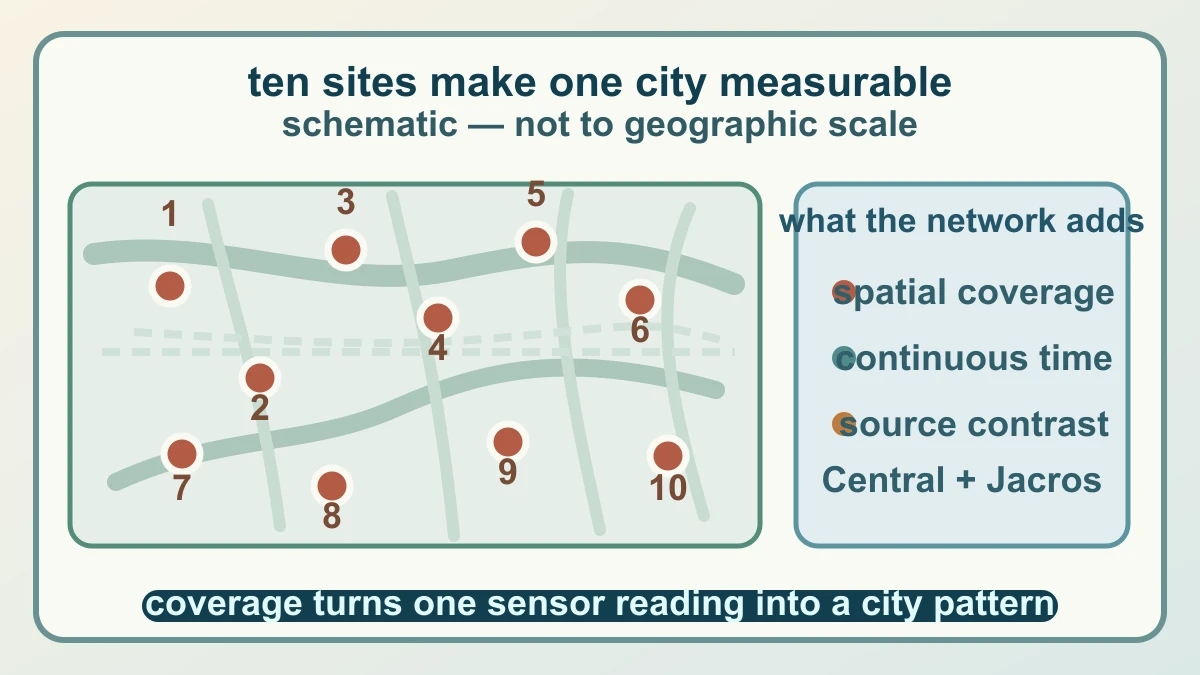
The network also changes the visual question. Instead of looking at one number and imagining a cause, researchers can ask whether a rush-hour rise repeats at multiple locations, whether a holiday event changes the pattern, or whether a signal is concentrated near one part of the city. Those comparisons do not make the data perfect. They make the uncertainty visible, which is the first requirement for a source claim that can be checked rather than merely guessed.
Ten sites turn soot into a space-and-time record
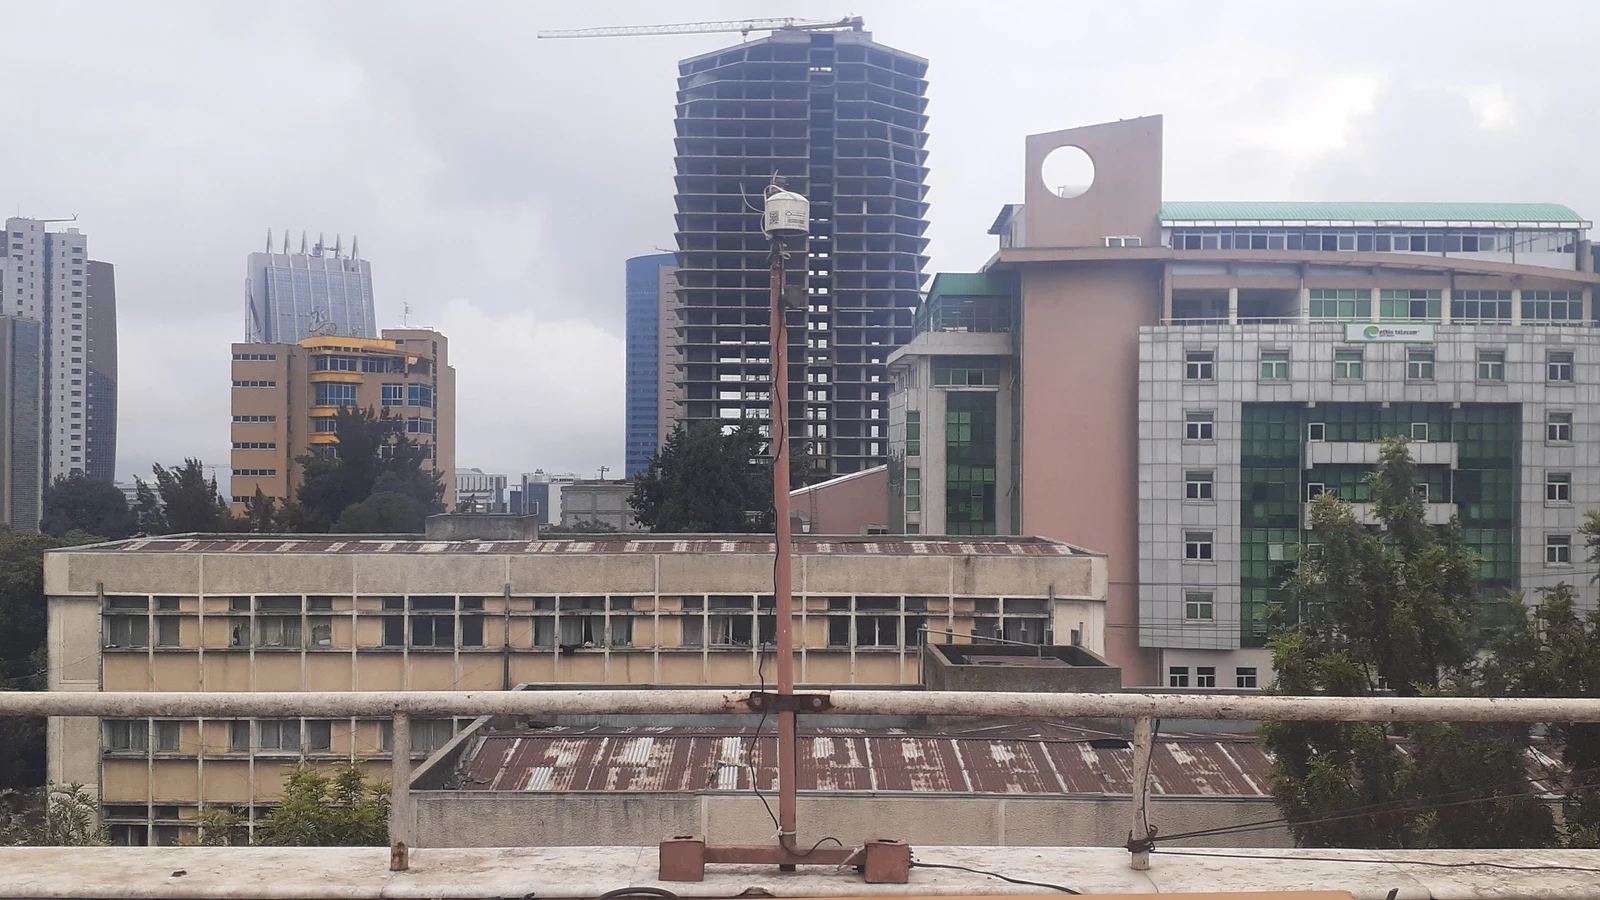
From April 2022 to March 2025, the Addis Ababa monitoring project used ten PurpleAir sensors to record PM2.5, with calibration at two U.S. Embassy reference locations. Black carbon was measured with microAeth MA350 instruments at the Central and Jacros sites. The arrangement combines broad spatial coverage with more specialised black-carbon measurements, so the study can compare a citywide particle pattern with a smaller set of direct soot observations.
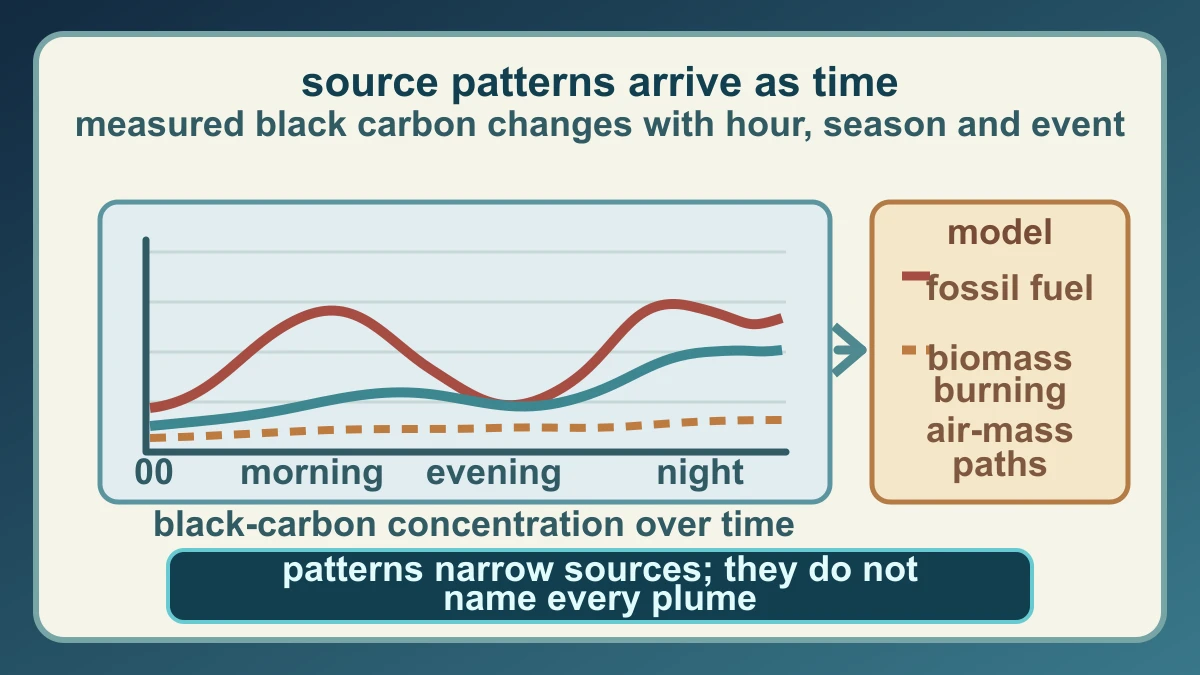
The reported average PM2.5 concentration was about 30 micrograms per cubic metre, and the study found black-carbon levels several times higher than those reported for three comparison U.S. metropolitan areas. More important for the method, the signals changed with hour, season and holiday conditions. A peak that repeats at a particular time or appears differently at different sites carries more source information than an isolated number, because the pattern can be compared with traffic activity, local events and meteorology.
The study then adds air-mass trajectories: estimates of where the air reaching a site has travelled. These paths provide context for whether a measured change is consistent with a local source or with air arriving from elsewhere. They do not draw a chemical fingerprint in the sky, and they cannot identify every individual plume. Their role is narrower and more useful: they add a directional constraint to the time and location evidence already in the network.
Source apportionment narrows the answer without becoming a health verdict
To estimate likely black-carbon sources, the researchers used an Aethalometer model that separates contributions associated with fossil-fuel combustion and biomass burning. The study reports an average estimate of 94% fossil-fuel and 6% biomass-burning contribution for the measured black carbon. That percentage is a model result for this dataset and period, not a direct label attached to every particle, every neighbourhood or every day.
The distinction matters because source apportionment is an inference built from assumptions, calibration and supporting observations. The model can narrow which explanation fits the measured change better, while trajectories and holiday or seasonal patterns add independent context. It does not prove that a specific vehicle, household or event caused a particular reading, and it does not provide a personalised health assessment. Keeping those boundaries in the article is part of reporting the result accurately.
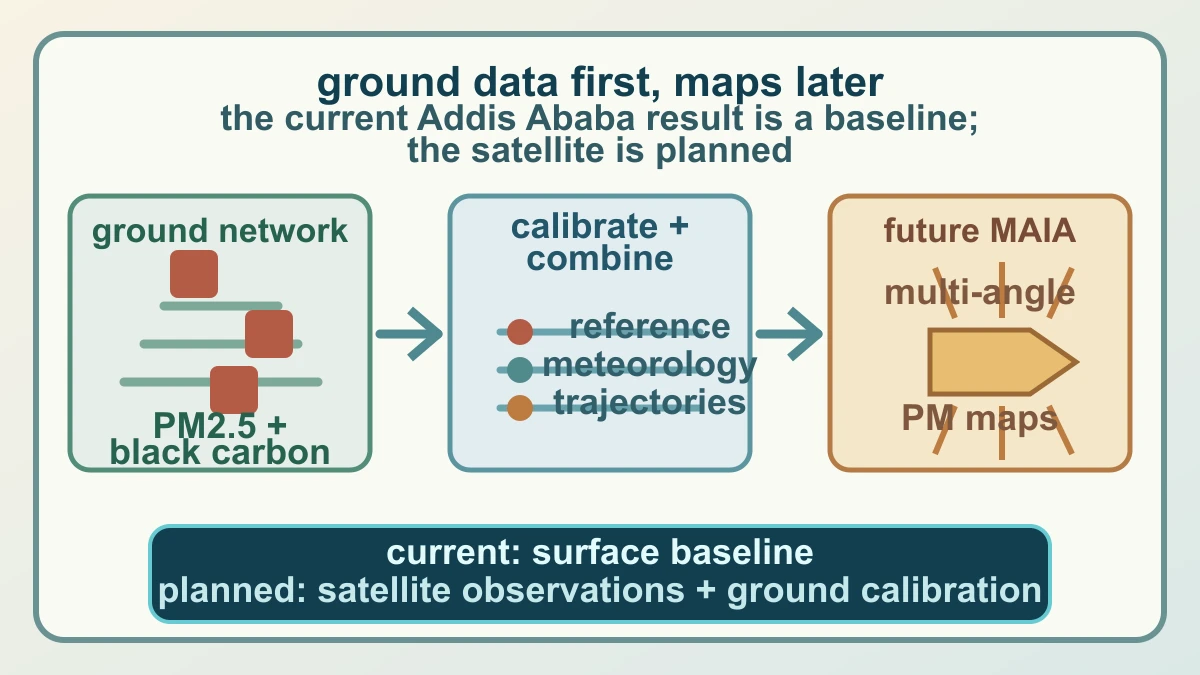
This ground network is also a baseline for the future MAIA mission, not a preview of data the satellite has already collected. NASA and JPL describe MAIA as a planned observatory using multi-angle observations and multiple spectral filters to study particulate-matter patterns, with ground measurements helping calibrate and interpret the satellite record. The present Addis Ababa result therefore answers a practical question now: how can repeated ground evidence narrow sources? The future mission may broaden the map, but it will still depend on the same discipline of separating measurement, model and conclusion.
Sources and further reading
- NASA: NASA Mission Studies Air Pollution Over Ethiopia ↗
- Crossref record for ACS ES&T Air: Spatial and Temporal Trends of Ambient PM2.5 and Source-Apportioned Black Carbon ↗
- JPL MAIA Mission Overview ↗
- NASA Science: MAIA Mission ↗
- U.S. EPA: Particulate Matter Basics ↗
- NASA Images and Media Usage Guidelines ↗
This article was written for Curiosity Desk. We do not copy other publishers or invent quotes. If a material error is found, we correct it openly.
Read the full standards →One answer should lead to a better question
Bring your curiosity to the group
Curious Minds is our public Facebook community for surprising science, strange history, Australian wildlife and everyday questions. No copied posts, no personal-friend invitations and no link dumping.
- Three self-contained discussion prompts each week
- Sourced answers and honest uncertainty
- Respectful conversation without spam