Why IRS 3 is still shedding material near Sgr A*
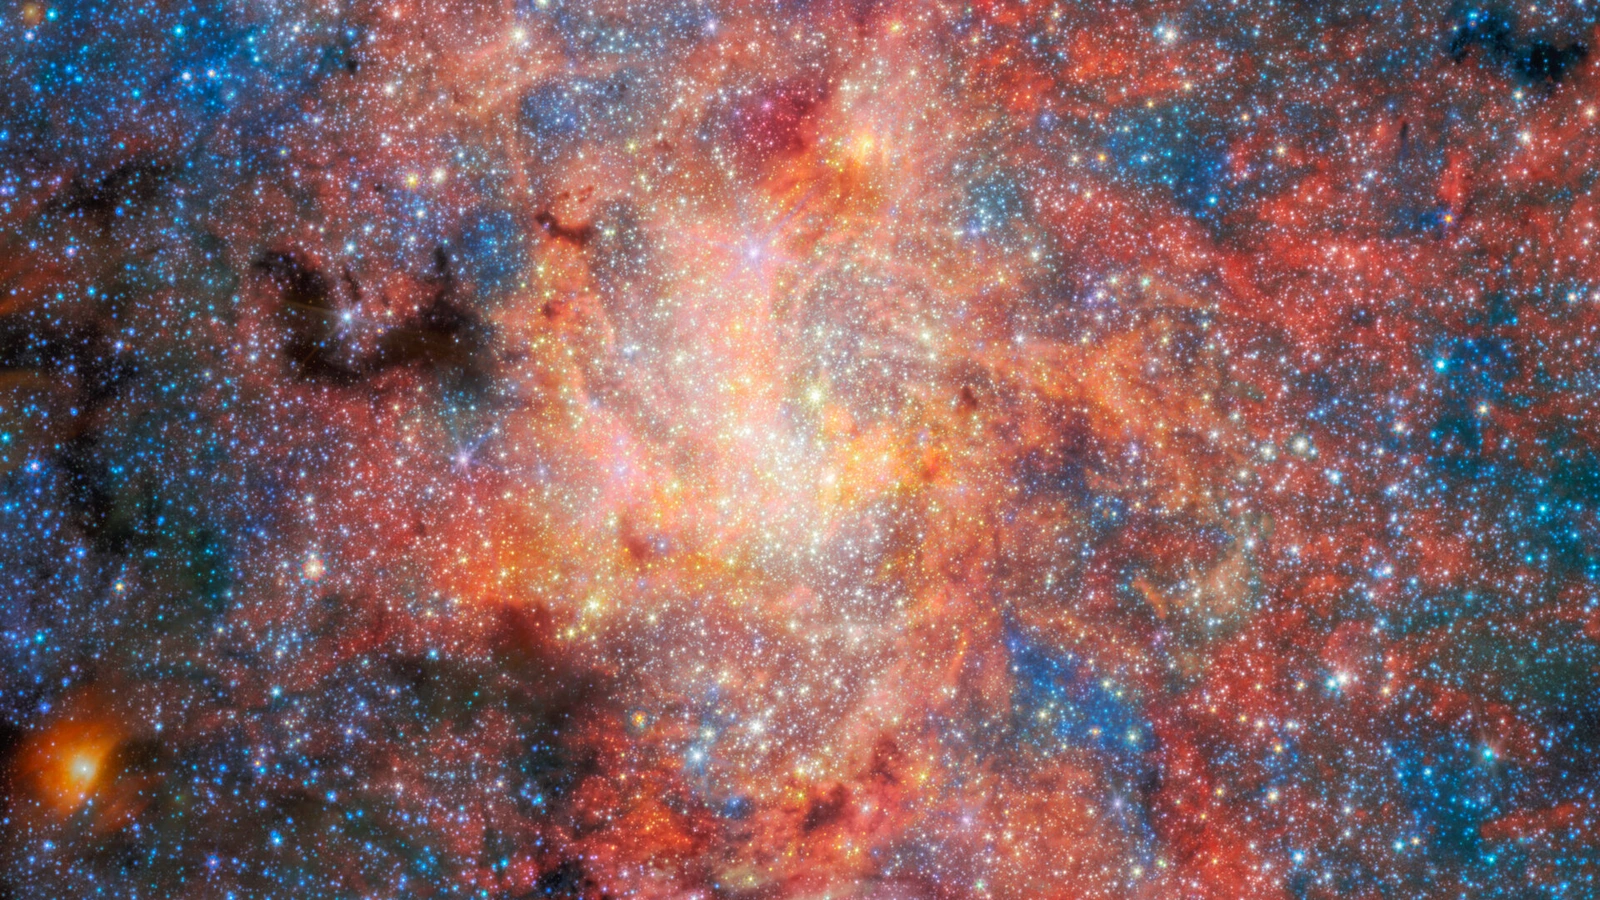
The short answer is that IRS 3 is an aging, oxygen-rich giant star whose own outflow can build a dusty envelope even in the harsh neighbourhood of Sagittarius A*. Webb did not photograph a puddle of water beside the black hole. Its instruments recorded a mid-infrared field and spectrum in which the star's surrounding material leaves chemical and thermal signatures. The observation keeps the story focused on one star's mass loss, not a new rule for every object in the Galactic Centre.
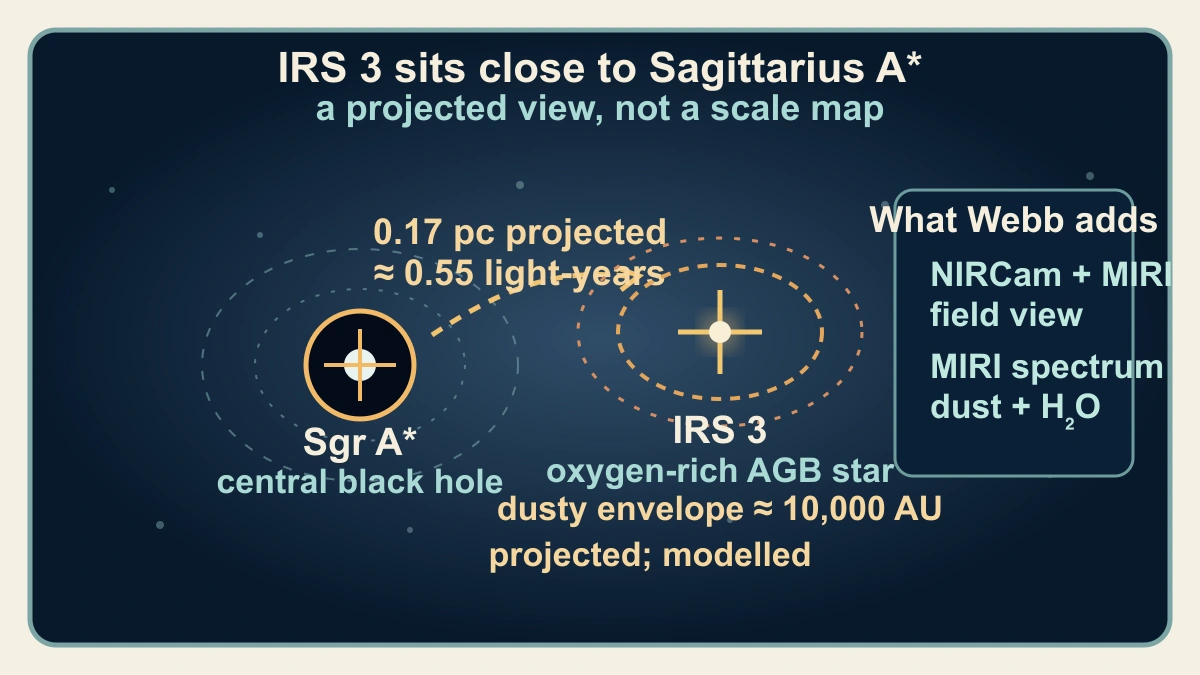
IRS 3 is close by astronomical standards: the paper places it about 0.17 parsec from Sgr A* in projection, or roughly 0.55 light-years. That is a projected separation across our view, not a measured three-dimensional distance or a scale map of the central region. The star's envelope extends to roughly 10,000 astronomical units in the paper's discussion. The large envelope matters because it gives material shed by the star room to cool, mix and retain a record of changing outflow conditions.
This makes the surprising part more precise. The central black hole is surrounded by an energetic environment, but the material Webb sees is still primarily the record of IRS 3's own wind and chemistry. The paper classifies the star as oxygen-rich and finds dust features expected from that kind of outflow. The result asks how a single evolved star keeps producing and carrying dusty material so close to Sgr A*; it does not establish a universal distance at which dust or water must disappear.
How Webb's spectrum identifies dust and water
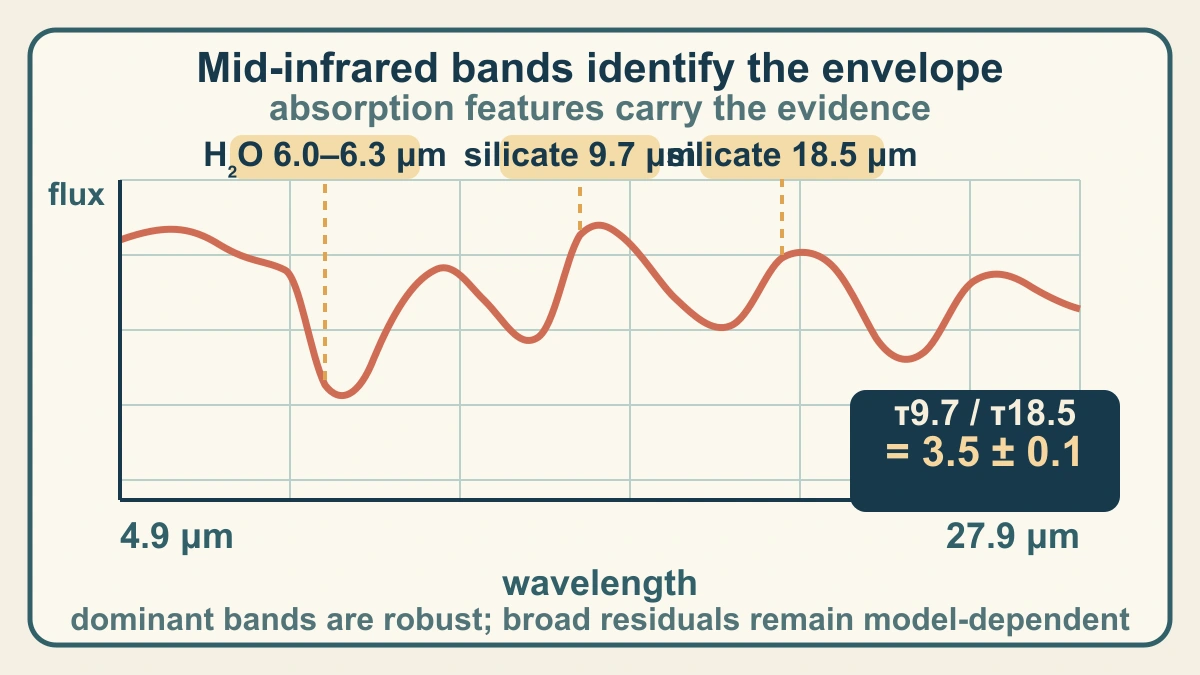
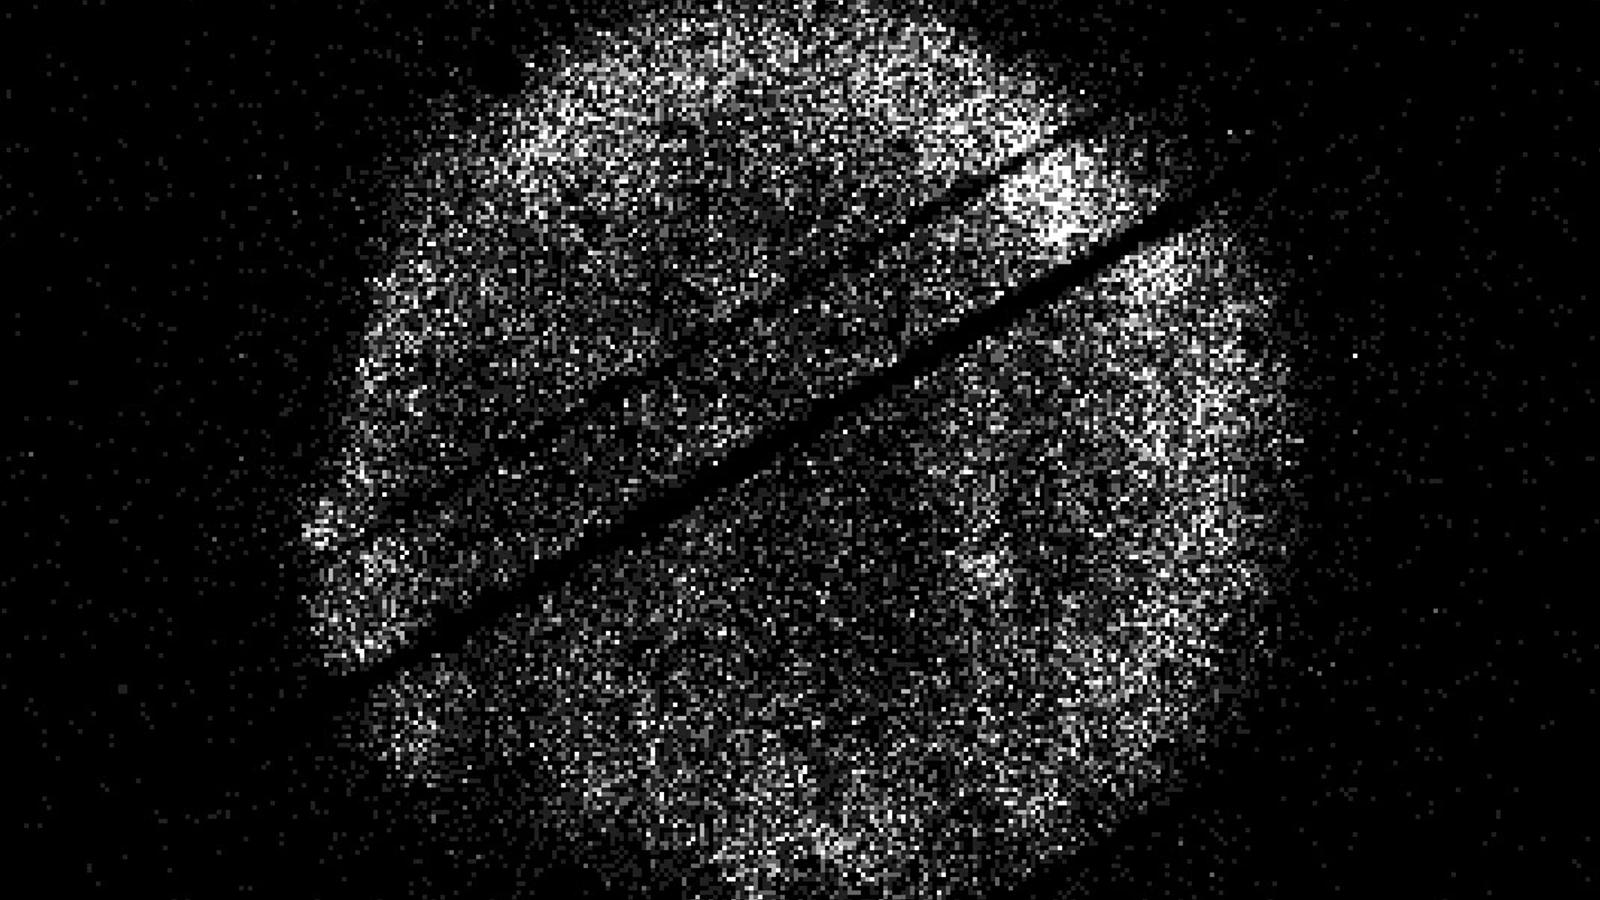
Webb's Mid-Infrared Instrument, or MIRI, is useful here because warm dust and molecules absorb and emit at infrared wavelengths. The reported MIRI Medium Resolution Spectrograph observation covers about 4.9 to 27.9 micrometres. Instead of relying on the colour of a picture, the researchers inspect dips and shapes in the spectrum. Around 6.0 to 6.3 micrometres, and again across a broader 6.7 to 7.0 micrometre region, the spectrum contains absorption signatures associated with water. Strong silicate features appear near 9.7 and 18.5 micrometres.
The silicate pair gives the dust classification a quantitative anchor. The paper reports an optical depth of 2.98 ± 0.07 at 9.7 micrometres and 0.85 ± 0.01 at 18.5 micrometres, a ratio of 3.5 ± 0.1. The oxygen-rich interpretation remains stable when the researchers test different extinction laws, which describe how foreground material changes the light on its way to us. That is stronger evidence than a single attractive feature, although it still depends on careful reduction and correction of the spectrum.
Water is the part that needs the most careful wording. The paper finds a good match to a line list around 6.0 to 6.25 micrometres, but it also flags a narrow feature near 6.19 micrometres and broad residuals that could involve ice, larger molecules, foreground emission or imperfect extinction correction. In other words, the spectrum contains water absorption signs in the authors' interpretation. It does not tell us that liquid water exists there, that every feature has one cause, or that the envelope has been inventoried molecule by molecule.
What the layered envelope explains—and what it does not
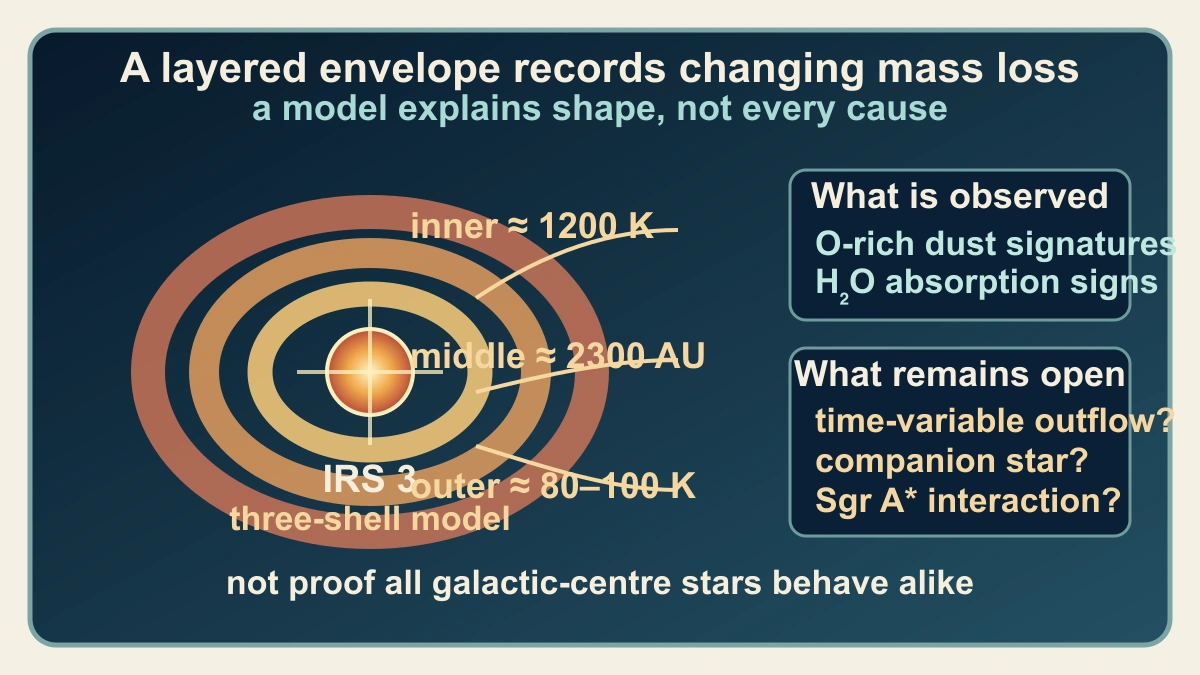
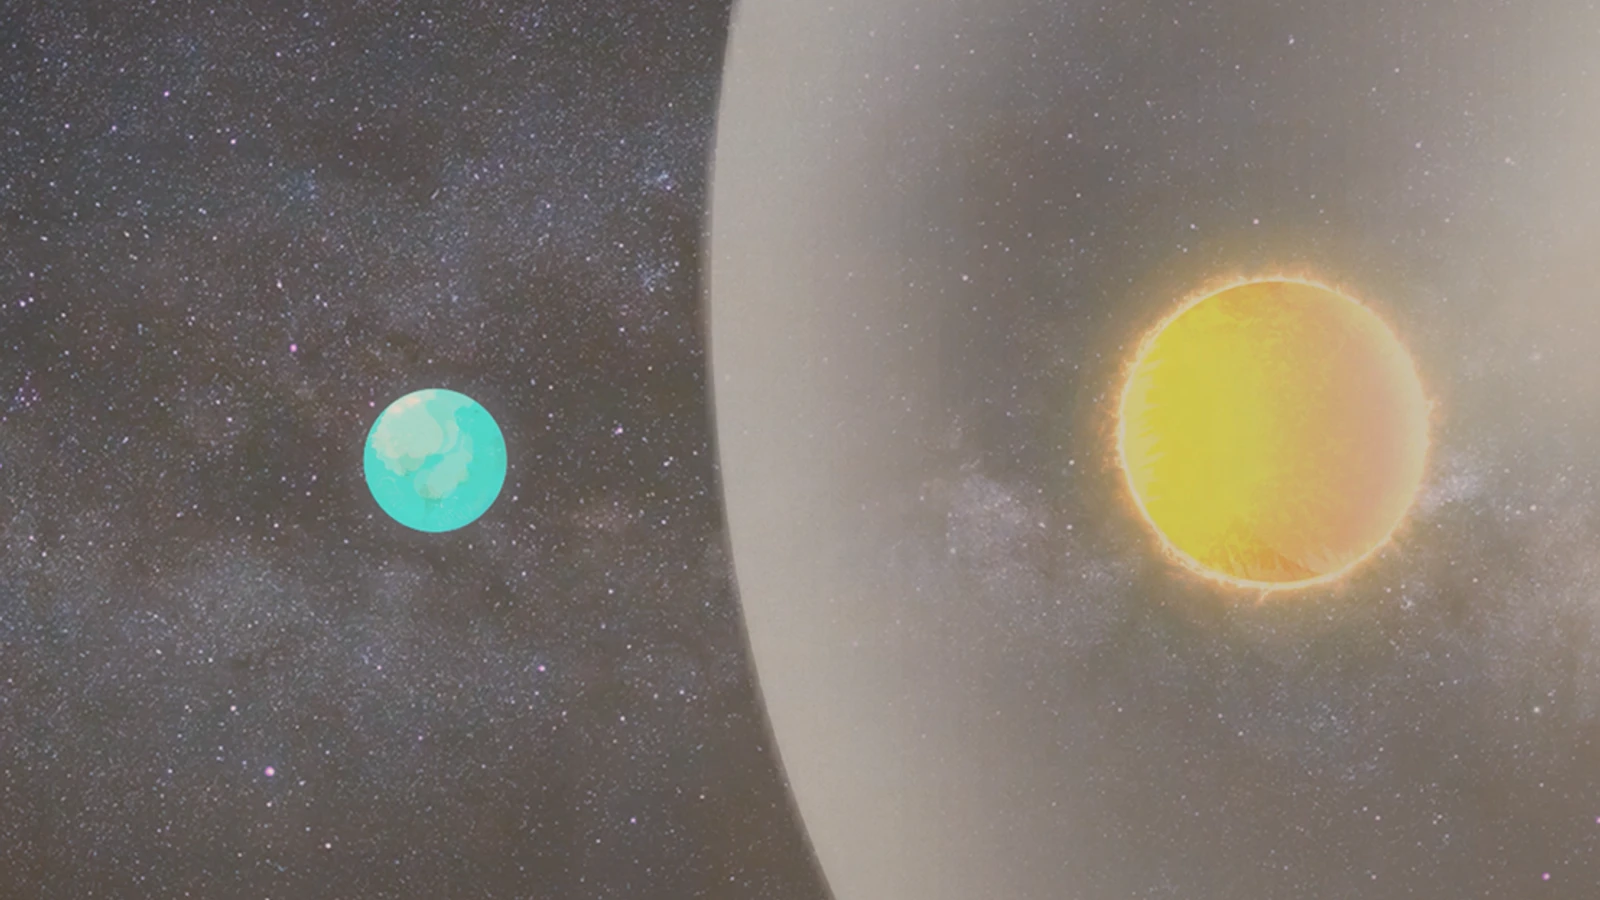
To turn the spectrum into a physical picture, the researchers fit radiative-transfer models that track how radiation moves through dust. Their preferred three-shell model places the warm inner region near 1,200 kelvin and the outer material around 80 to 100 kelvin, with a middle shell near a few thousand astronomical units. The model gives a coherent way to explain why different wavelengths see different layers. It is not a direct photograph of three clean rings, and the paper notes mismatches that could reflect grain sizes, porosity, clumps, ice or extinction residuals.
The same caution applies to the wind history. Under an assumed wind velocity of about 15 kilometres per second, the paper estimates a mass-loss rate of roughly 6 × 10⁻⁵ solar masses per year. That number is useful for comparing a model with the data, but it is not a scale reading taken from the image. Multiple shells could record time-variable outflows, a companion star or interaction with the central environment. Bow-shock and clump effects may also shape parts of the spectrum. The observation narrows the possibilities; it does not choose one cause by itself.
What is established is therefore clear but limited: IRS 3 is an oxygen-rich evolved star, its JWST spectrum carries silicate and water absorption signatures, and a layered model can reproduce much of the observed envelope. What remains open is how the layers formed, how long each outflow episode lasted and how much the nearby Galactic Centre environment changed them. The useful next question is not whether all stars near black holes behave this way, but which part of IRS 3's own history the next observation can separate.
Sources and further reading
- ESA: Dust and water spotted close to giant black hole ↗
- arXiv: Dust production in harsh environment of Sgr A* ↗
- ESA: IRS 3 Field (NIRCam and MIRI image) ↗
- ESA/Webb: IRS 3 dust and water release ↗
- STScI: JWST Mid-Infrared Instrument ↗
- STScI: MIRI filters and dispersers ↗
- Creative Commons: Attribution 4.0 International ↗
This article was written for Curiosity Desk. We do not copy other publishers or invent quotes. If a material error is found, we correct it openly.
Read the full standards →One answer should lead to a better question
Bring your curiosity to the group
Curious Minds is our public Facebook community for surprising science, strange history, Australian wildlife and everyday questions. No copied posts, no personal-friend invitations and no link dumping.
- Three self-contained discussion prompts each week
- Sourced answers and honest uncertainty
- Respectful conversation without spam